
扩展功能
文章信息
- 王艳发, 魏士平, 崔鸿鹏, 苏新, 祝有海, 卢振权, 胡非, 李来鹏, 张帅, 刘晖
- WANG Yan-Fa, WEI Shi-Ping, CUI Hong-Peng, SU Xin, ZHU You-Hai, LU Zhen-Quan, HU Fei, LI Lai-Peng, ZHANG Shuai, LIU Hui
- 青藏高原冻土区土壤垂直剖面中微生物的分布与多样性
- Distribution and diversity of microbial community along a vertical permafrost profile, Qinghai-Tibetan Plateau
- 微生物学通报, 2016, 43(9): 1902-1917
- Microbiology China, 2016, 43(9): 1902-1917
- DOI: 10.13344/j.microbiol.china.151074
-
文章历史
- 收稿日期: 2015-12-31
- 接受日期: 2016-03-22
- 优先数字出版日期(www.cnki.net): 2016-04-18
2. 中国地质大学(北京) 地质过程与矿产资源国家重点实验室 北京 100083 ;
3. 中国地质调查局油气资源调查中心 北京 100029
2. State Key Laboratory of Geological Processes and Mineral Resources, China University of Geosciences, Beijing 100083, China ;
3. Oil and Gas Survey, China Geological Survey, Beijing 100029, China
冻土在全球的分布十分广泛,在北半球从北纬26°的喜马拉雅山脉至北纬84°的格陵兰岛北部都有分布[1],大约占地球陆地面积的26%[2-3]。冻土在地球上的分布主要受纬度与海拔的影响,分为高纬度冻土和高海拔冻土[4]。据最新的研究估计,冻土土壤的含碳量(1 672 Pg)约占全球地下有机碳库的50%,超过了植被(650 Pg)和大气(730 Pg)含碳量的总和[5-6]。冻土是陆地生态系统中最容易受到外界变化影响的碳库,起着碳源与碳汇的作用。因此,对于维持全球碳平衡具有至关重要的作用。由于外界 条件发生变化而引起的冻土退化将导致储存在冻土中的土壤有机碳在短时间内迅速释放,引起强烈的温室效应,进而对全球的生态平衡产生影响[7]。研究表明,环北极冻原地带每年释放的甲烷约占全球产生甲烷的6%,其对全球温室效应的贡献值却高达20%左右[8]。随着全球变暖,冻土区已经开始融化[9-10],伴随着冻土融化,冻土活动层的厚度增加,大量的土壤有机碳将由冻土释放到大气中,而这一过程主要是通过微生物的分解作用来完成的,通过微生物的分解所产生的二氧化碳和甲烷等温室气体被排放到大气中,冻土将由碳汇逐渐转化为碳源[7, 11],在一定程度上将会进一步加剧全球温室效应。因此,了解冻土土壤微生物的组成及其分布特征对洞察冻土区以及全球生态环境的变化具有重要的意义[12]。
在冻土环境中,包括古菌、细菌、真菌在内的多种微生物进行着各种代谢活动。对加拿大近北极冻土层古菌群落结构的研究表明,广古菌(Euryarchaeota)占61%,泉古菌(Crenarchaeota)占39%[13]。对冻土区活动层与冻土层的调查显示,细菌具有较高的生物多样性,主要的优势类群包括放线菌(Actinobacteria)、变形菌(Proteobacteria)、酸杆菌(Acidobacteria)、芽单胞菌(Gemmatimonadetes)[14]。来自西伯利亚苔原带的资料显示,从活动层到冻土层细菌总细胞数的变化范围为2.3×10⁹-1.2×10⁸ cells/g[15]。近期对北美北极冻土区真菌群落结构组成与分布的研究显示,该区真菌序列主要属于子囊菌门(Ascomycota)和担子菌门(Basidiomycota)两大类,分别占真菌OTUs总数的16.1%和83.9%[16]。资料显示,在冻土这种极端的生态环境下,温度和冻融过程等因素都将显著影响和限制冻土中微生物的生理、代谢途径以及生态结构,微生物代谢活性跟有机质分解速率密切相关,而温度是控制有机质分解速率的主导因素,且分解速率与温度呈正相关[17-18]。据研究,冻结条件下,冻土微生物的转录活性将受到抑制,并削弱DNA及蛋白质的合成[19];冻土温度升高可以增加产甲烷菌的活性,因此会增加产CH4速率[20]。低温限制微生物的生长、代谢、有机物的降解过程,同时也决定了营养物质的存在状态和可利用程度;冻融过程不仅直接损伤细胞,还通过影响生境因素而间接的影响细胞生存和生理代谢[17]。在全球气候变暖背景下,冻土退化导致冻土土壤地温升高,冻土活动层深度增加,冻土层逐渐向冻土活动层过渡,该过程对活动层的热、质传输和土壤微生物的群落结构、系统发育、功能基因和代谢途径等都将产生一定的影响[17-18, 20]。另一方面,随着冻土融化,储存于冻土中的土壤有机碳被释放到活动层,被土壤中的微生物充分利用,并由于土壤温度的增高,其代谢进一步加强,加速了土壤有机碳的分解,导致大量温室气体进入大气,从而可能会对全球气候变暖产生正反馈作用[20]。因此,对冻土土壤微生物在垂直剖面上的分布与多样性进行研究,将有助于正确认识与评价冻土中的微生物对未来全球气候变化所起的作用以及所产生的潜在威胁。
本文采样点位于青藏高原冻土区,作为全球最大的高山冻土区,平均海拔在4 000 m以上,其面积为1.5×10⁶ km2,大约为中国冻土总面积的69.77%[21-22]。青藏高原是全球气候变暖的敏感区,近42年来气候存在着变暖的总趋势[23]。研究表明青藏高原湿地年均CH4释放率为0.7-1.0 Tg[24]。近年来,伴随着全球气候变暖,青藏高原冻土区已经开始发生退化,对青藏高原冻土区土壤微生物进行研究,将有助于对该区冻土退化及冻土区生态环境效应进行监测。然而,目前国内外对高山冻土区土壤微生物的研究还比较薄弱。在本文中,我们对青藏高原冻土区垂直剖面微生物的分布及其多样性进行了研究,并分析了微生物结构组成与生态环境之间的关系。
1 材料与方法 1.1 采样点描述与样品采集本文所采集的DP-14样品来自于青藏高原永久冻土区,采样点地理坐标为北纬38°06′08.32′′、东经99°10′43.88′′,海拔4 017 m。该区也是我国陆域天然气水合物分布的重要区域,它位于青藏高原北缘青海省木里地区[25],2008年以来,中国地质调查局实施了“青藏高原冻土带天然气水合物调查评价”项目,并在DK-1、DK-2、DK-3、DK-7、DK-8钻位,133 m-396 m深度发现有天然气水合物赋存[25-26]。该区年平均地表温度为-1.5-2.4 ℃[27],降雨多出现于夏季,而冬季降雨稀少,区内土壤多呈弱酸性。作为青藏高原多年冻土区,冻土活动层厚度大约为0.2 m-0.6 m,该区实测冻土层的厚度为60 m-95 m[28]。
土壤样品采集于2014年11月,在同一垂直剖面上按40 cm的采样深度,间距采取25-30、65-70、105-110 cm 3个不同深度的土壤样品,分别编号为DP-14-1、DP-14-2、DP-14-3,其中DP-14-1和DP-14-2位于冻土活动层,DP-14-3位于冻土层,根据活动层土壤的干湿程度不同,将靠近冻土层的部分称为冻土过渡层,采样点DP-14-2位于该层。所采集的样品装入无菌封口塑料袋中,用来进行样品理化性质分析,装入50 mL无菌离心管中的样品用来进行微生物学的分析。采样结束后,所有样品放入隔热容器中,用干冰运至实验室,于-20 ℃保存。
1.2 主要试剂和仪器FastDNA® SPIN Kit for Soil试剂盒,美国MP Biomedicals公司;DNA片段快速胶回收试剂盒,美国AxyPrep公司;pGEM-T Easy Vector System,美国Promega公司;Axygen Plasmid Mini Kit试剂盒,美国Axygen公司;染料法荧光定量试剂盒SYBR Premix ExTaq和大肠杆菌DH5α感受态细胞,日本TaKaRa公司。
紫外分光光度计NanoDrop 1000,美国Thermo Fisher Scientific公司;pH计PB-10,德国Sartorius公司;5417R高速台式离心机,德国Eppendorf公司;碳氮元素分析仪Multi N/C2100s,德国analytikjena公司;Agilent 7890A气相色谱仪,美国Agilent公司;Mastersize 2000激光粒度仪,英国Malvern公司;ABI 7500荧光定量PCR仪,美国Applied Biosystems公司。
1.3 土壤样品参数测定采集土壤样品时,通过向剖面各层土壤中插入测温计的方法对冻土原地温度进行测定。样品pH值的测定方法:称取2.0 g土壤样品与5.0 mL无菌水于15 mL无菌离心管中混合均匀,将pH计插入离心管中,测出样品的pH值。称取5.0 g样品于105 ℃烘箱中放置24 h,烘干前后样品重量损失的差值与烘干前重量的百分比即为土壤样品的含水量。称取18.0 mg烘干的土壤样品,以CaCO3 (10.0 mg)作为标准样品,用碳氮元素分析仪进行样品总有机碳量(TOC)的测定。顶空气甲烷浓度采用Agilent 7890A气相色谱仪进行测定,为了分析甲烷浓度,将5.0 g土壤样品加入到装有20 mL饱和NaCl溶液的50 mL细口瓶中(每个土壤样品装3个),瓶口用固体丁基橡胶塞密封,在测定前连续摇晃瓶身1 h,结果采取3个样品测试结果的平均值,并以平均值加减标准误差的形式表示。剖面样品粒度使用Mastersize 2000激光粒度仪进行测定,操作方法见实验室仪器使用流程,测定前用过氧化氢(加热)与稀盐酸溶液去除样品中的有机质,并用无菌水洗涤样品3次。
1.4 DNA提取分别称取1.0 g土壤样品,使用FastDNA® SPIN kit for soil试剂盒提取土壤样品中的总DNA,方法参考使用说明,提取的DNA溶于100 μL无菌的超纯水中。使用紫外分光光度计对样品总DNA的浓度及纯度进行测定。
1.5 PCR扩增与构建克隆文库古菌、细菌、真菌的PCR扩增体系为:10×PCR buffer 2.5 μL,dNTPs mixture 2.0 μL,10 μmol/L PCR forward primer 1.0 μL,10 μmol/L PCR reverse primer 1.0 μL,20.0 g/L Bovine serum albumin solution 1.0 μL,rTaq DNA polymerase 0.5 μL,DNA模板 1.0 μL,ddH2O 16.0 μL,总体积25.0 μL。PCR扩增所用引物及扩增程序见表 1[29-33]。PCR扩增产物经1%的琼脂糖凝胶电泳检测后进行切胶。
| 引物对 Primer | 菌类 Domain | 引物对序列 Sequences (5′→3′) | 靶基因 Target genes | 应用 Application | PCR反应程序 PCR amplification reaction process | 参考文献 Reference |
| 109F/958R | Archaea | ACKGCTCAGTAACACGT/YCCGGCGTTGAMTCCAATT | 16S rRNA | PCR | 95 ℃ 7 min;94 ℃ 30 s,54 ℃ 30 s,72 ℃ 1.5 min,(38 cycle);72 ℃ 10 min | [29] |
| 27F/1492R | Bacteria | AGAGTTTGATCCTGGCTCAG/ GGTTACCTTGTTACGACTT | 16S rRNA | PCR | 95 ℃ 7 min;94 ℃ 30 s,55 ℃ 30 s,72 ℃ 1.5 min,38 cycle;72 ℃ 10min | [30] |
| ITS1F/ITS4 | Fungi | CTTGGTCATTTAGACGAAGTAA/ TCCTCCGCTTATTGATATGC | ITS | PCR | 94 ℃ 5 min;94 ℃ 30 s,57 ℃ 30 s,72 ℃ 1.0 min,(38 cycle);72 ℃ 15 min | [31] |
| 349F/806R | Archaea | GYGCASCAGKCGMGAAW/ GGACTACVSGGGTATCTAAT | 16S rRNA | qPCR | 95 ℃ 30 s,95 ℃ 5 s (40 cycle);60 ℃ 34 s | [32] |
| 338F/518R | Bacteria | ACTCCTACGGGAGGCAGCAG/ ATTACCGCGGCTGCTGG | 16S rRNA | qPCR | 95 ℃ 30 s;95 ℃ 5 s (40 cycle);60 ℃ 34 s | [33] |
| ITS1F/ITS4 | Fungi | CTTGGTCATTTAGACGAAGTAA/ TCCTCCGCTTATTGATATGC | ITS | qPCR | 95 ℃ 30 s;95 ℃ 5 s (40 cycle);60 ℃ 34 s | [31] |
PCR扩增产物经DNA片段快速胶回收试剂盒进行纯化回收。纯化回收后的PCR产物链接到pGEM-T Easy Vector上,链接方法参考使用说明。经4.0 ℃隔夜后转化Escherichia coli JM109感受态细胞。转化后的感受态细胞加入1.0 mL SOC溶液,37 ℃、150 r/min培养1 h后,取适量培养物涂到含氨苄青霉素、X-Gal、IPTG的LB固体平板(LB营养琼脂16 g,无菌水500 mL,氨苄青霉素0.05 g,X-Gal 1mL,IPTG 0.5 mL)上,37.0 ℃培养箱中培养至菌落出现。
1.6 系统发育分析与多样性分析随机挑取LB固体平板上部分白色转化子,37 ℃、150 r/min培养后,使用Axygen Plasmid Mini Kit试剂盒提取其质粒DNA,古菌采用109F引物,细菌采用27F引物,真菌采用T7引物,分别对质粒上的插入片段进行古菌16S rRNA基因、细菌 16S rRNA基因和真菌ITS的测序。
使用Sequencer 4.8 (Gene codes corporation,US)软件剪辑原始序列,经BioEdit软件中的ClustalW multiple alignment进行序列相关性比对,使用DOTUR软件以97%的序列相似性划分OTU (Operational taxonomic unit),挑出OTU对应序列并在NCBI GenBank数据库中通过在线使用BLAST程序(Basic local alignment search tool)进行序列比对,获得与样品环境来源相似并且序列相似度较高的序列作为参比序列,OTU序列与参比序列用MEGA 4软件中的Neighbor-Joining法构建系统发育树。通过C=1-(n/N)计算克隆文库的覆盖饱和度,其中C为克隆文库覆盖率(Coverage),n为OTU中只出现一个克隆子的数目,N为克隆文库总序列 数[34]。文库多样性指数的计算方法参照Hill等[35]。
1.7 荧光定量PCR采用实时荧光定量PCR (Real-time PCR)分别测定古菌16S rRNA基因、细菌16S rRNA基因和真菌ITS基因的拷贝数,扩增所用引物见表 1[31-33]。反应体系为20 μL,组成如下:2×SYBR premix ExTaq 10 μL,10 μmol/L PCR forward primer 0.4 μL,10 μmol/L PCR reverse primer 0.4 μL,50×ROX reference dye Ⅱ 0.4 μL,各样品DNA 1.0 μL (40.0 ng/μL),ddH2O 7.8 μL。荧光定量PCR程序:按染料法荧光定量试剂盒SYBR Premix ExTaq操作说明书进行两步法荧光定量PCR扩增。
以上述PCR扩增后的胶回收产物作为模板分别计算古菌16S rRNA基因、细菌16S rRNA基因和真菌ITS的拷贝数[36],依次将其进行10倍梯度稀释,形成104、105、106、107、108、109 copies/μL六个梯度的标准溶液,作为基因荧光定量的标准曲线(R2>0.99)。qPCR反应条件为95 ℃ 30 s,95 ℃ 5 s (前两步进行40个循环);60 ℃ 34 s,于60 ℃延伸时收集荧光信号,所有样品均进行3次平行重复,拷贝数计算结果取3个平行重复的算术平均值,并以平均值加减标准误差的形式表示。
1.8 DNA序列的GenBank登录号本研究所测定的古菌、细菌与真菌克隆序列均已按OTU提交至GenBank数据库,其中古菌16S rRNA基因序列的登录号为:KT265194-KT265200;细菌16S rRNA基因序列的登录号为:KT265201-KT265221;真菌ITS序列的登录号为:KT265184-KT265193。
2 结果与分析 2.1 冻土样品理化特征通过对土壤剖面地温的原地测量,发现地温沿着剖面方向呈现下降趋势,从冻土活动层的-5.33 ℃降至冻土层的-8.12 ℃,采样点周边的平均气温约为-3.48 ℃。剖面土壤样品的pH为5.60-6.17,呈弱酸性。由于冻土层常年含有大量的冰渍,因此,该层土壤中的含水量最高(72.03%),冻土活动层土壤的含水量也相对较高(59.09%),这可能是由于该地区夏季频繁的降水在冬季冻结于活动层的缘故。总有机碳(TOC)在冻土过渡层与冻土层含量较低(7.52%、10.90%),而活动层TOC含量较高,达到20.08%,推测这可能与表层分布大量的植被有关。甲烷含量在冻土活动层最低,仅为7.81±1.22 nmol/g,随着深度的增加甲烷含量迅速增大,到冻土层时达到最大值206.43±17.46 nmol/g,数据表明冻土活动层与冻土层的甲烷含量差异明显(表 2)。粒度的分析结果显示,剖面土壤主要由砂(26.48%-36.00%)、粉砂(49.49%-59.42%)和粘土(14.04%-16.43%)组成。
| 深度 Depth (cm) | 温度 Temperature (℃) | pH | 含水量 Water content (%) | 总有机碳 TOC (%) | 甲烷 CH4 (nmol/g) | 砂 Sand (%) | 粉砂 Silt (%) | 粘土 Clay (%) |
| 25-30 | -5.33 | 5.74 | 59.09 | 20.08 | 7.81±1.22 | 26.48 | 59.42 | 14.11 |
| 65-70 | -6.52 | 5.60 | 18.70 | 7.52 | 13.90±2.41 | 33.56 | 50.01 | 16.43 |
| 105-110 | -8.12 | 6.17 | 72.03 | 10.09 | 206.43±17.46 | 36.00 | 49.96 | 14.04 |
通过构建古菌16S rRNA基因克隆文库对古菌群落组成与多样性进行分析。所测序列经筛选后得到100个有效古菌序列,分属于7个OTUs,其中冻土活动层包括6个OTUs,过渡层包括4个OTUs,冻土层包括5个OTUs,文库覆盖率为96.8%-97.1%。Shannon多样性指数与Simpson优势度指数的变化幅度分别为0.96-1.53和0.25-0.54,冻土活动层古菌多样性最高,冻土层具有最高的古菌优势度;实时荧光定量PCR结果显示,冻土活动层与冻土层之间古菌基因拷贝数为每克土壤(1.81±0.41)×107-(2.44±0.21)×107,差异性较小 (表 3)。
| 菌类 Domain | 深度 Depth (cm) | 序列数 No. of sequences | OTU数 No. of OTUs | 覆盖率Coverage (%) | Shannon index | Simpson index | 拷贝数 No. of copies (×107/g soil) |
| Archaea | 25-30 | 35 | 6 | 97.1 | 1.53 | 0.25 | 2.44±0.21 |
| 65-70 | 33 | 4 | 96.9 | 0.99 | 0.42 | 2.26±0.23 | |
| 105-110 | 32 | 5 | 96.8 | 0.96 | 0.54 | 1.81±0.41 | |
| Bacteria | 25-30 | 28 | 11 | 85.7 | 2.23 | 0.13 | 45.6±4.30 |
| 65-70 | 26 | 12 | 92.3 | 2.43 | 0.10 | 19.2±2.00 | |
| 105-110 | 29 | 5 | 96.5 | 1.21 | 0.39 | 18.7±2.40 | |
| Fungi | 25-30 | 26 | 2 | 96.2 | 0.16 | 0.93 | 1.64±0.10 |
| 65-70 | 35 | 7 | 94.3 | 1.58 | 0.25 | 1.35±0.21 | |
| 105-110 | 32 | 6 | 93.8 | 1.31 | 0.27 | 1.67±0.41 |
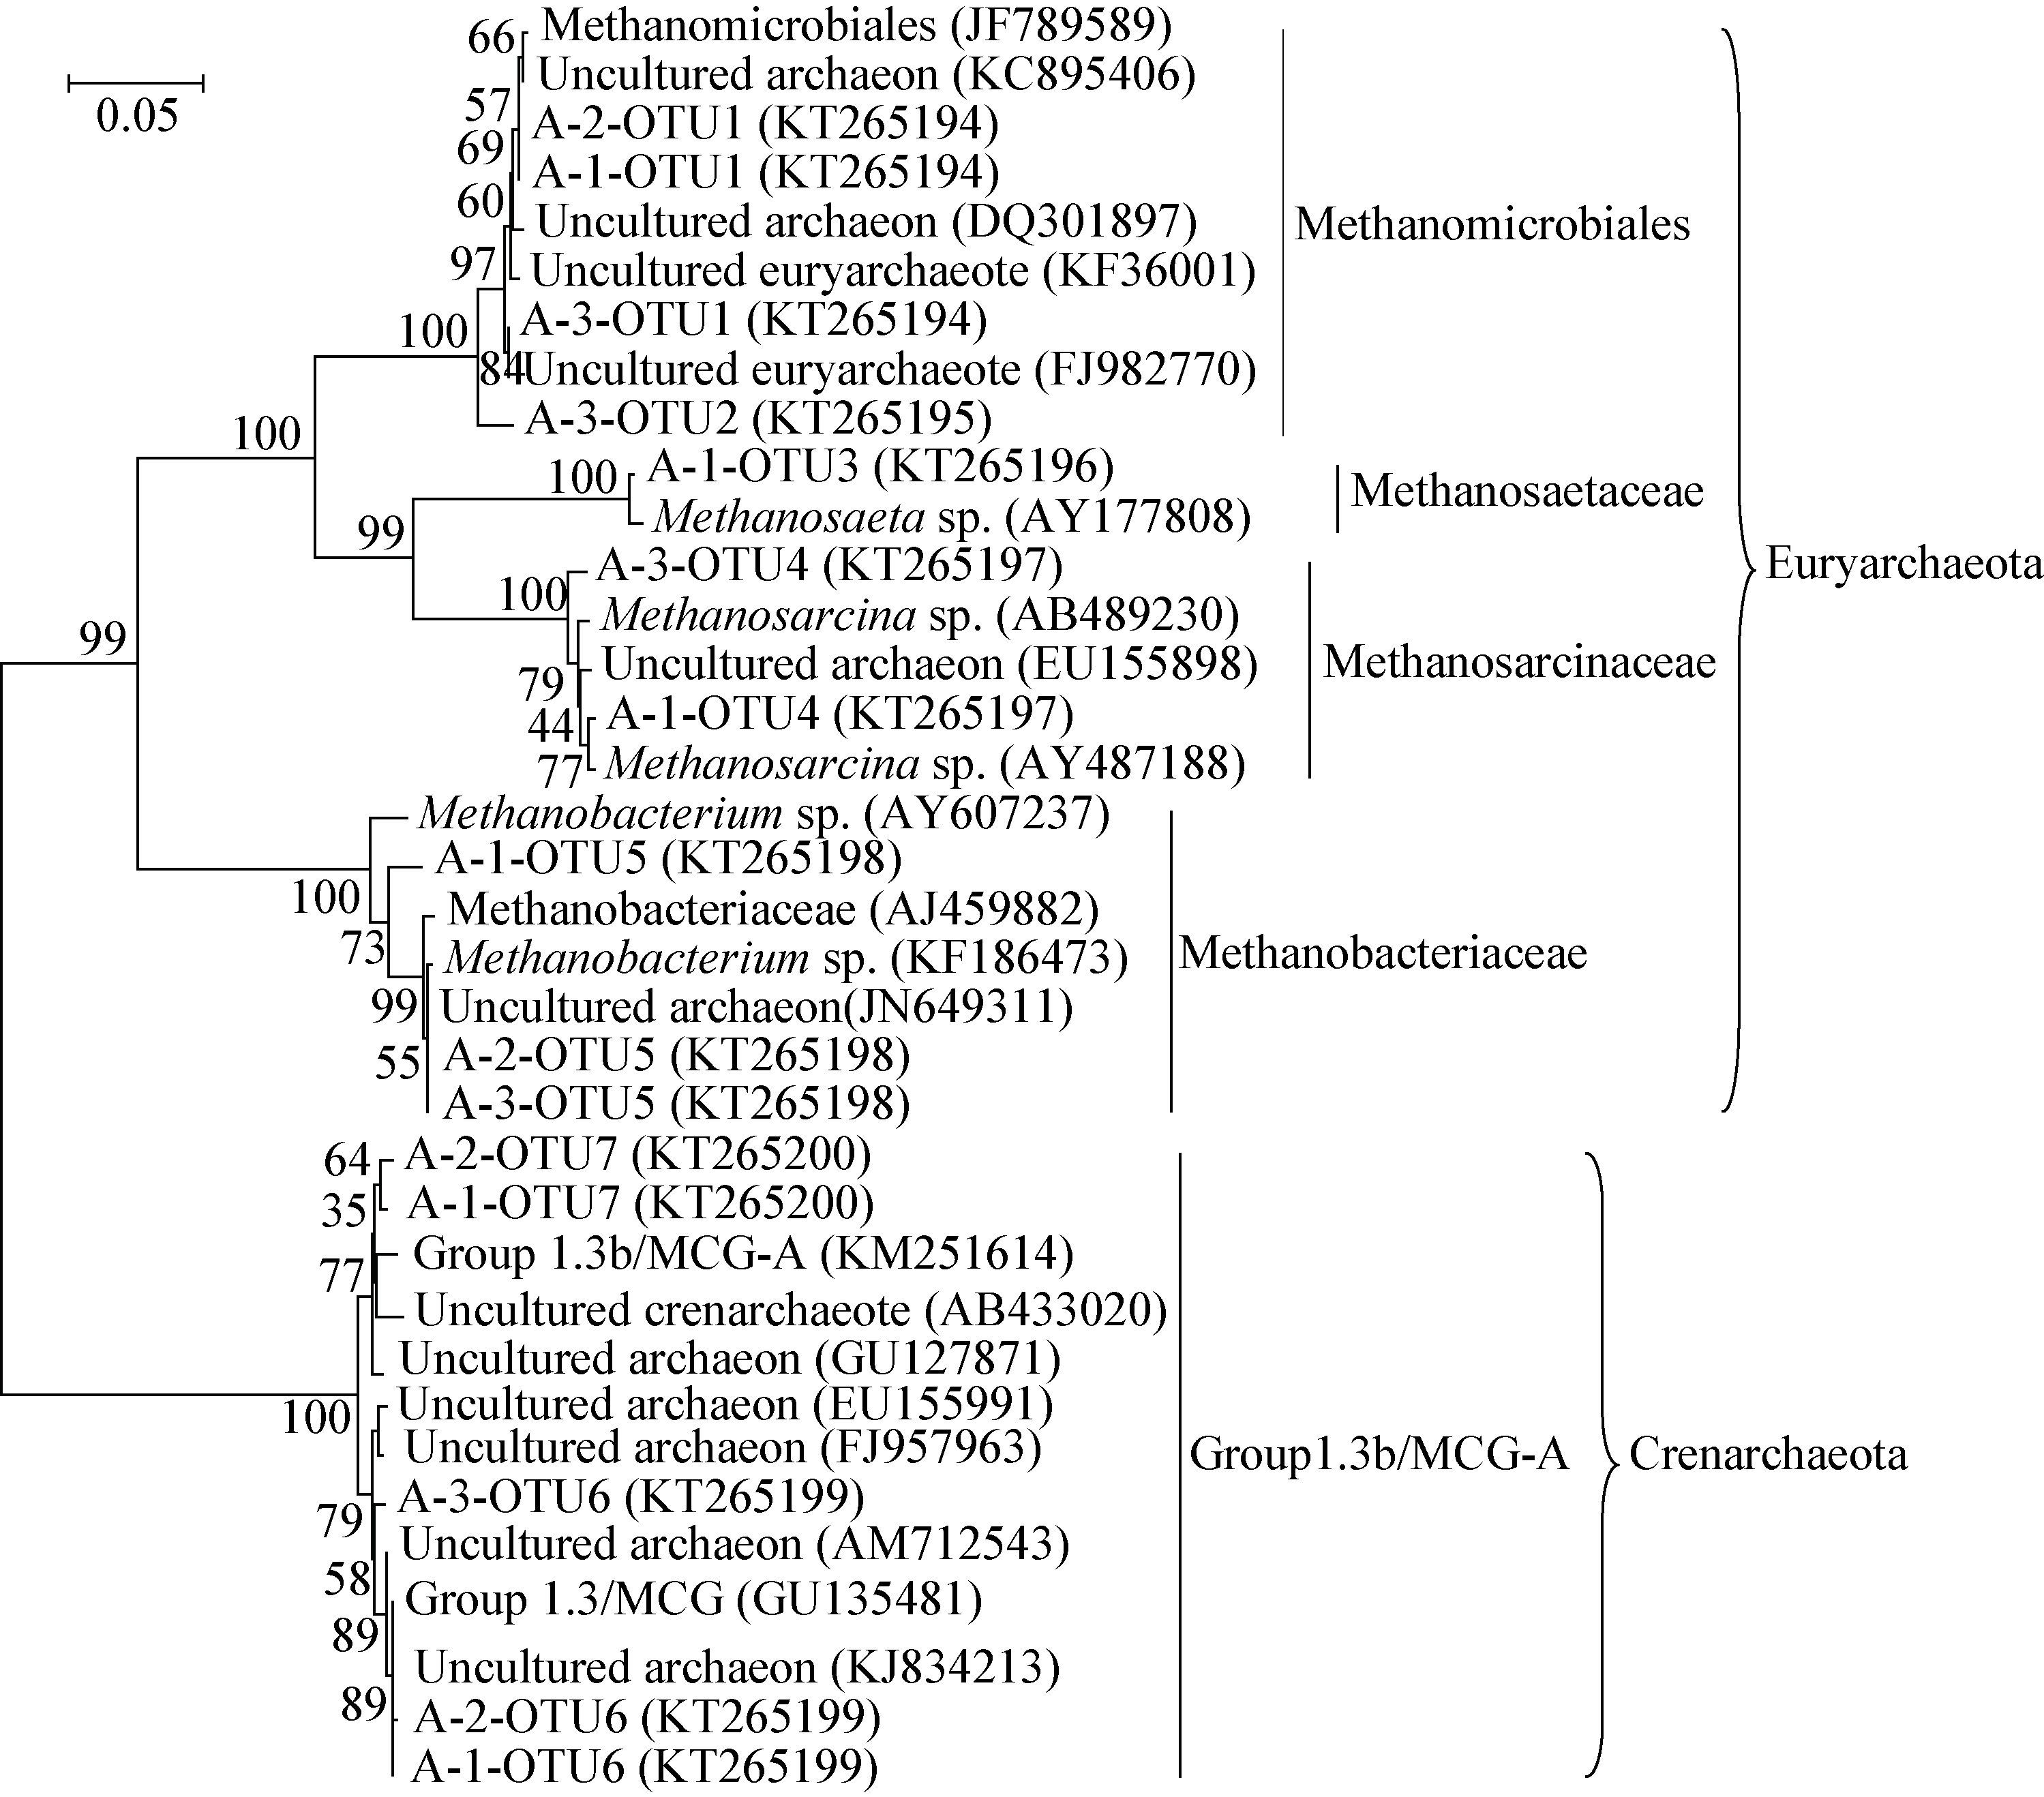
古菌16S rRNA基因序列系统发育树显示,所测剖面古菌序列属于泉古菌(Crenarchaeota)和广古菌(Euryarchaeota)两大类,分别占克隆序列总数的29.0%和71.0%。其中,泉古菌只包括Group1.3b/MCG-A这一种类型,共有29个克隆序列属于该类群,占古菌克隆序列总数的29.0%;共有71个克隆序列属于广古菌,包括4种类型:Methanomicrobiales、Methanosarcinaceae、Methanosaetaceae和Methanobacteriaceae,分别占古菌克隆序列总数的52.0%、5.0%、9.0% 和5.0% (图 1)。
|
| 图 1 青藏高原冻土区剖面土壤中古菌16S rRNA基因序列系统发育树 Figure 1 Phylogenetic tree of archaeal 16S rRNA gene sequences from a stratigraphic soil profile in the Qinghai-Tibetan Plateau 注:A-1表示冻土活动层,A-2表示冻土过渡层,A-3表示冻土层;序列的登录号位于圆括号内;系统发育树分支点处的数字表示置信值(>50%);标尺表示100个核苷酸中有5个被替换. Note: A-1,A-2 and A-3 represent the active layer,the transition layer and the permafrost layer,respectively; The accession number is shown in parenthesis; Numbers at the branch points indicated the bootstrap values (>50%); The scale bar corresponds to 0.05 substitutions per nucleotide position. |
|
|
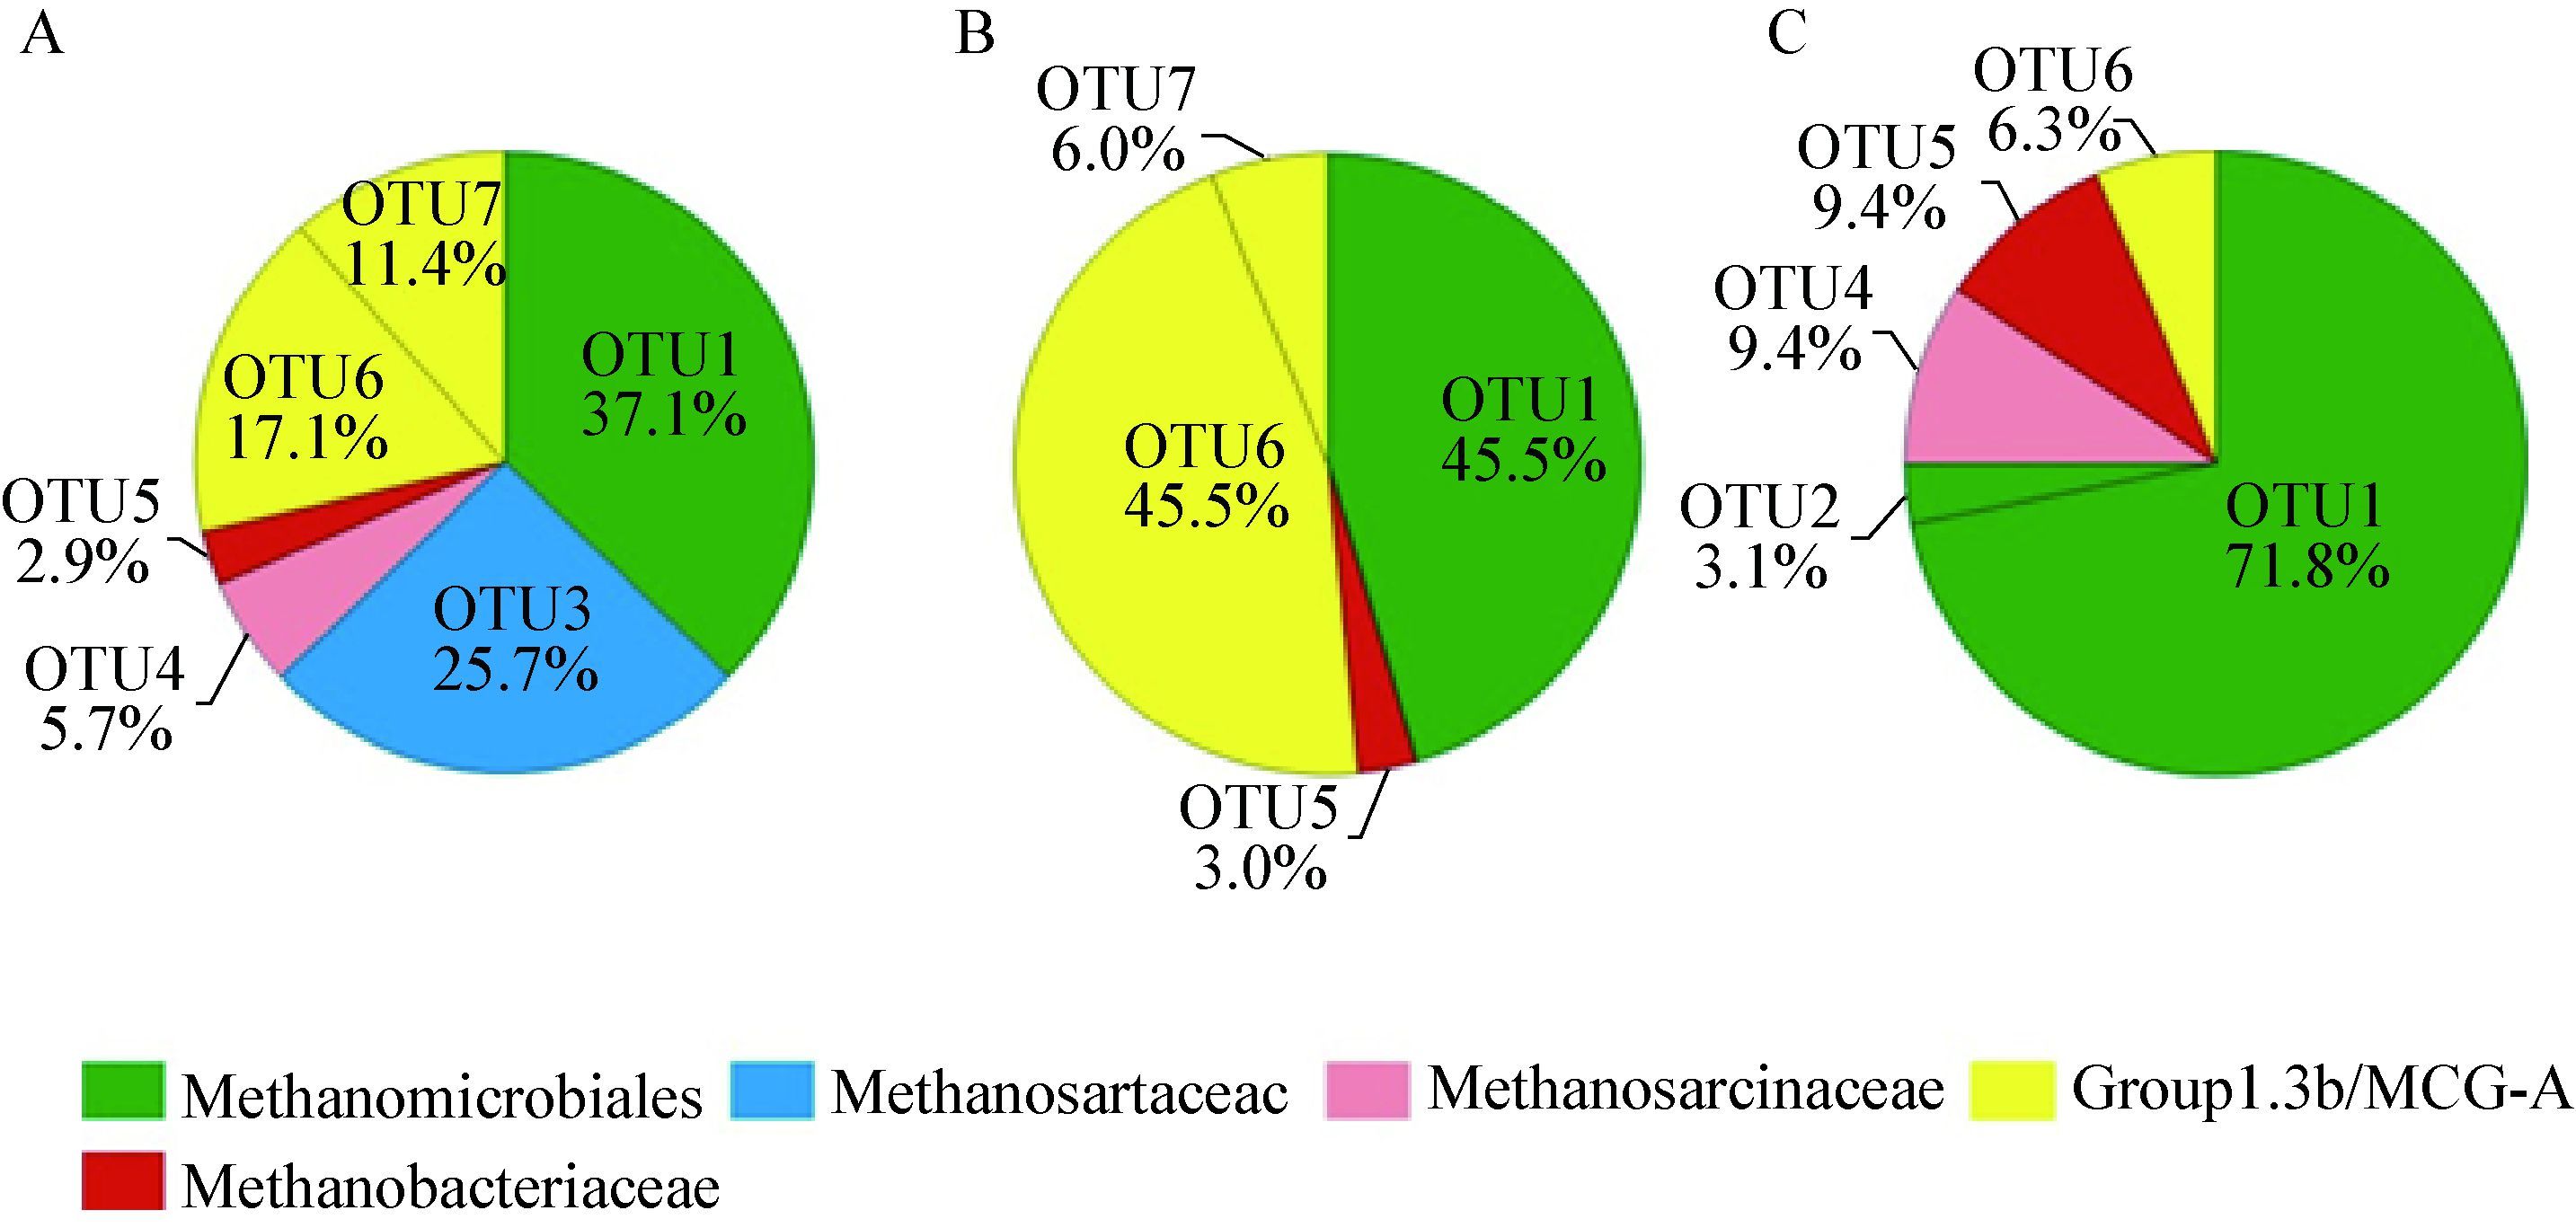
从图 2中可以看出剖面各层位广古菌、泉古菌的组成比例差异较为明显。在冻土活动层广古菌、泉古菌分别占71.5%和28.5%,而在冻土层,广古菌(93.7%)则进一步成为优势类群,泉古菌的相对丰度仅为6.3%。在冻土过渡层,广古菌与泉古菌之间的相对丰度比例未显示出明显的差异,分别占48.5%和51.5%。古菌OTU的垂直分布显示,OTU1和OTU2属于Methanomicrobiales,随着深度的增加OTU1的相对丰度逐渐增加,由冻土活动层的37.1%增加到冻土层的71.8%,OTU2 (3.1%)只出现于冻土层,推断OTU2的出现可能受到低温的控制(表 2);隶属于Methanosaetaceae的OTU3,只出现于活动层(25.7%)。除OTU1外,OTU5和OTU6也为冻土活动层、过渡层与冻土层所共有,它们分别属于Methanobacteriaceae和Group1.3b/MCG-A,且随着深度的增加OTU5的相对丰度略有增加,而OTU6在冻土过渡层占有较大的比例(45.5%)。
|
| 图 2 DP-14剖面不同深度古菌OTU分析图 Figure 2 Relative abundance and distribution of each archaeal OTU along the soil profile of DP-14 注:A表示冻土活动层;B表示冻土过渡层;C表示冻土层. Note: A,B and C represent the active layer,the transition layer and the permafrost layer,respectively. |
|
|
通过构建细菌16S rRNA基因克隆文库对细菌群落组成与多样性进行分析。所测序列经筛选后得到83个有效细菌序列,分属于21个OTUs,其中冻土活动层包括11个OTUs,过渡层包括12个OTUs,冻土层包括5个OTUs。文库覆盖率为85.7%-96.5%。Shannon多样性指数与Simpson优势度指数的变化幅度为1.21-2.43和0.10-0.39,结果显示冻土过渡层细菌表现出了较高的多样性;实时荧光定量PCR结果显示,冻土活动层与冻土层之间细菌基因拷贝数为每克土壤(1.87±0.24)×108- (4.56±0.43)×108,差异性较小(表 3)。
细菌16S rRNA基因序列系统发育树显示,细菌序列分属于10个类群,其中放线菌(Actinobacteria)、厚壁菌(Firmicutes)与变形菌(Proteobacteria)为主要的优势类群,分别占克隆序列总数的28.9%、16.9%和12.1%。酸杆菌(Acidobacteria)、嗜热丝菌(Caldiserica)、拟杆菌(Bacteroidetes)以及未分类的细菌序列,所占比例分别为7.2%、6.0%、8.4%和9.6%。Verrucomicrobia、Armatimonadetes、Gemmatimonadetes在细菌克隆序列中所占的比例较低(图 3)。

|
| 图 3 青藏高原冻土区剖面土壤中细菌16S rRNA基因序列系统发育树 Figure 3 Phylogenetic tree of bacterial 16S rRNA gene sequences from a stratigraphic soil profile in the Qinghai-Tibetan Plateau 注:B-1表示冻土活动层,B-2表示冻土过渡层,B-3表示冻土层;序列的登录号位于圆括号内;系统发育树分支点处的数字表示置信值(>50%);标尺表示100个核苷酸中有2个被替换. Note: B-1,B-2 and B-3 represent the active layer,the transition layer and the permafrost layer,respectively; The accession number is shown in parenthesis; Numbers at the branch points indicated the bootstrap values (>50%); The scale bar corresponds to 0.02 substitutions per nucleotide position. |
|
|
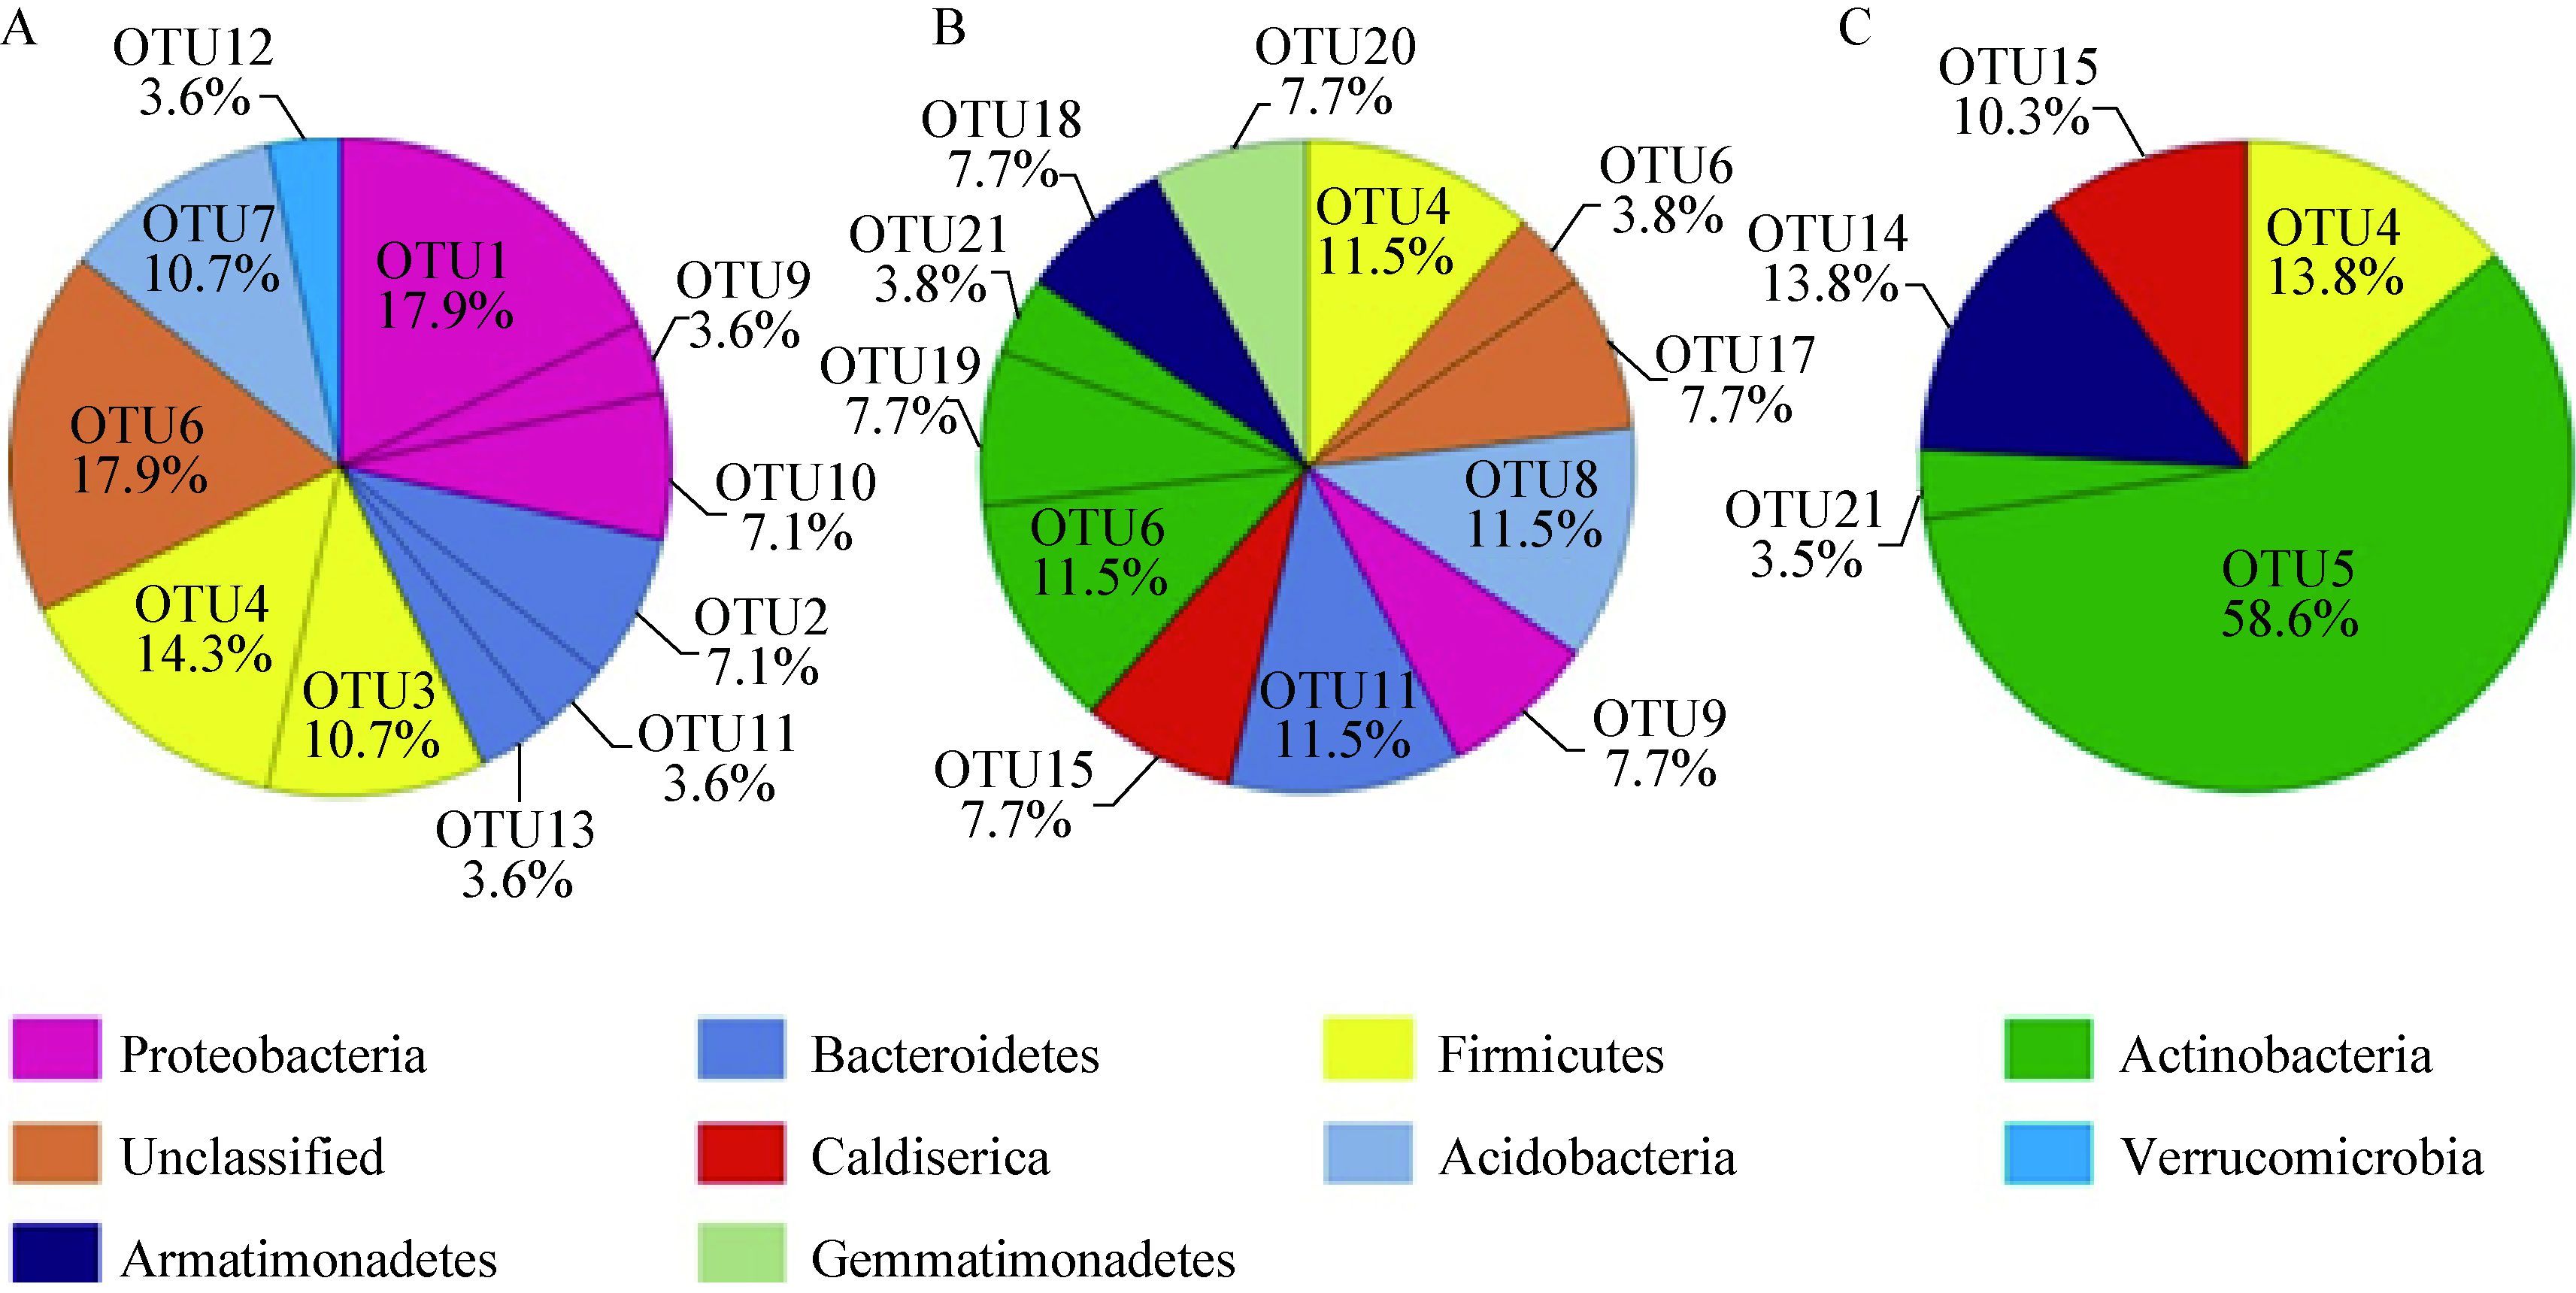
细菌在剖面各层位之间的相对丰度与分布具有较大的差异性(图 4)。在冻土活动层,Proteobacteria (28.6%)、Firmicutes (25.0%)、Bacteroidetes (14.3%)为主要的优势类群,而未分类序列在该层也占有较大的比例(17.9%);细菌在冻土层的分布显示,冻土层只包括4种类型(Actinobacteria、Armatimonadetes、Caldiserica、Firmicutes),其中Actinobacteria占据了较高的比例(62.1%);冻土过渡层细菌的相对丰度与分布情况较为复杂,共包括9种类型,且在该层序列总数中所占比例差异性较小,这可能与过渡层特殊的理化性质有关,比例较高的类群为Actinobacteria (23.0%)、Firmicutes (11.5%)、Acidobacteria (11.5%)、Bacteroidetes (11.5%)。
|
| 图 4 DP-14剖面不同深度细菌OTU分析图 Figure 4 Relative abundance and distribution of each bacterial OTU along the soil profile of DP-14 注:A表示冻土活动层;B表示冻土过渡层;C表示冻土层. Note: A,B and C represent the active layer,the transition layer and the permafrost layer,respectively. |
|
|
通过构建真菌ITS克隆文库对剖面真菌群落组成与多样性进行分析。所测序列经筛选后得到 93个有效真菌序列,分属于10个OTUs,其中冻土活动层仅包括2个OTUs,过渡层包括7个OTUs,冻土层包括6个OTUs。文库覆盖率为93.8%-96.2%。Shannon多样性指数与Simpson优势度指数的变化幅度为0.16-1.58和0.25-0.93,结果显示冻土活动层真菌Simpson优势度最高,而Shannon多样性则最低;实时荧光定量PCR结果显示,冻土活动层与冻土层之间真菌基因拷贝数为 每克土壤(1.35±0.21)×107-(1.67±0.41)×107,差异性较小(表 3)。
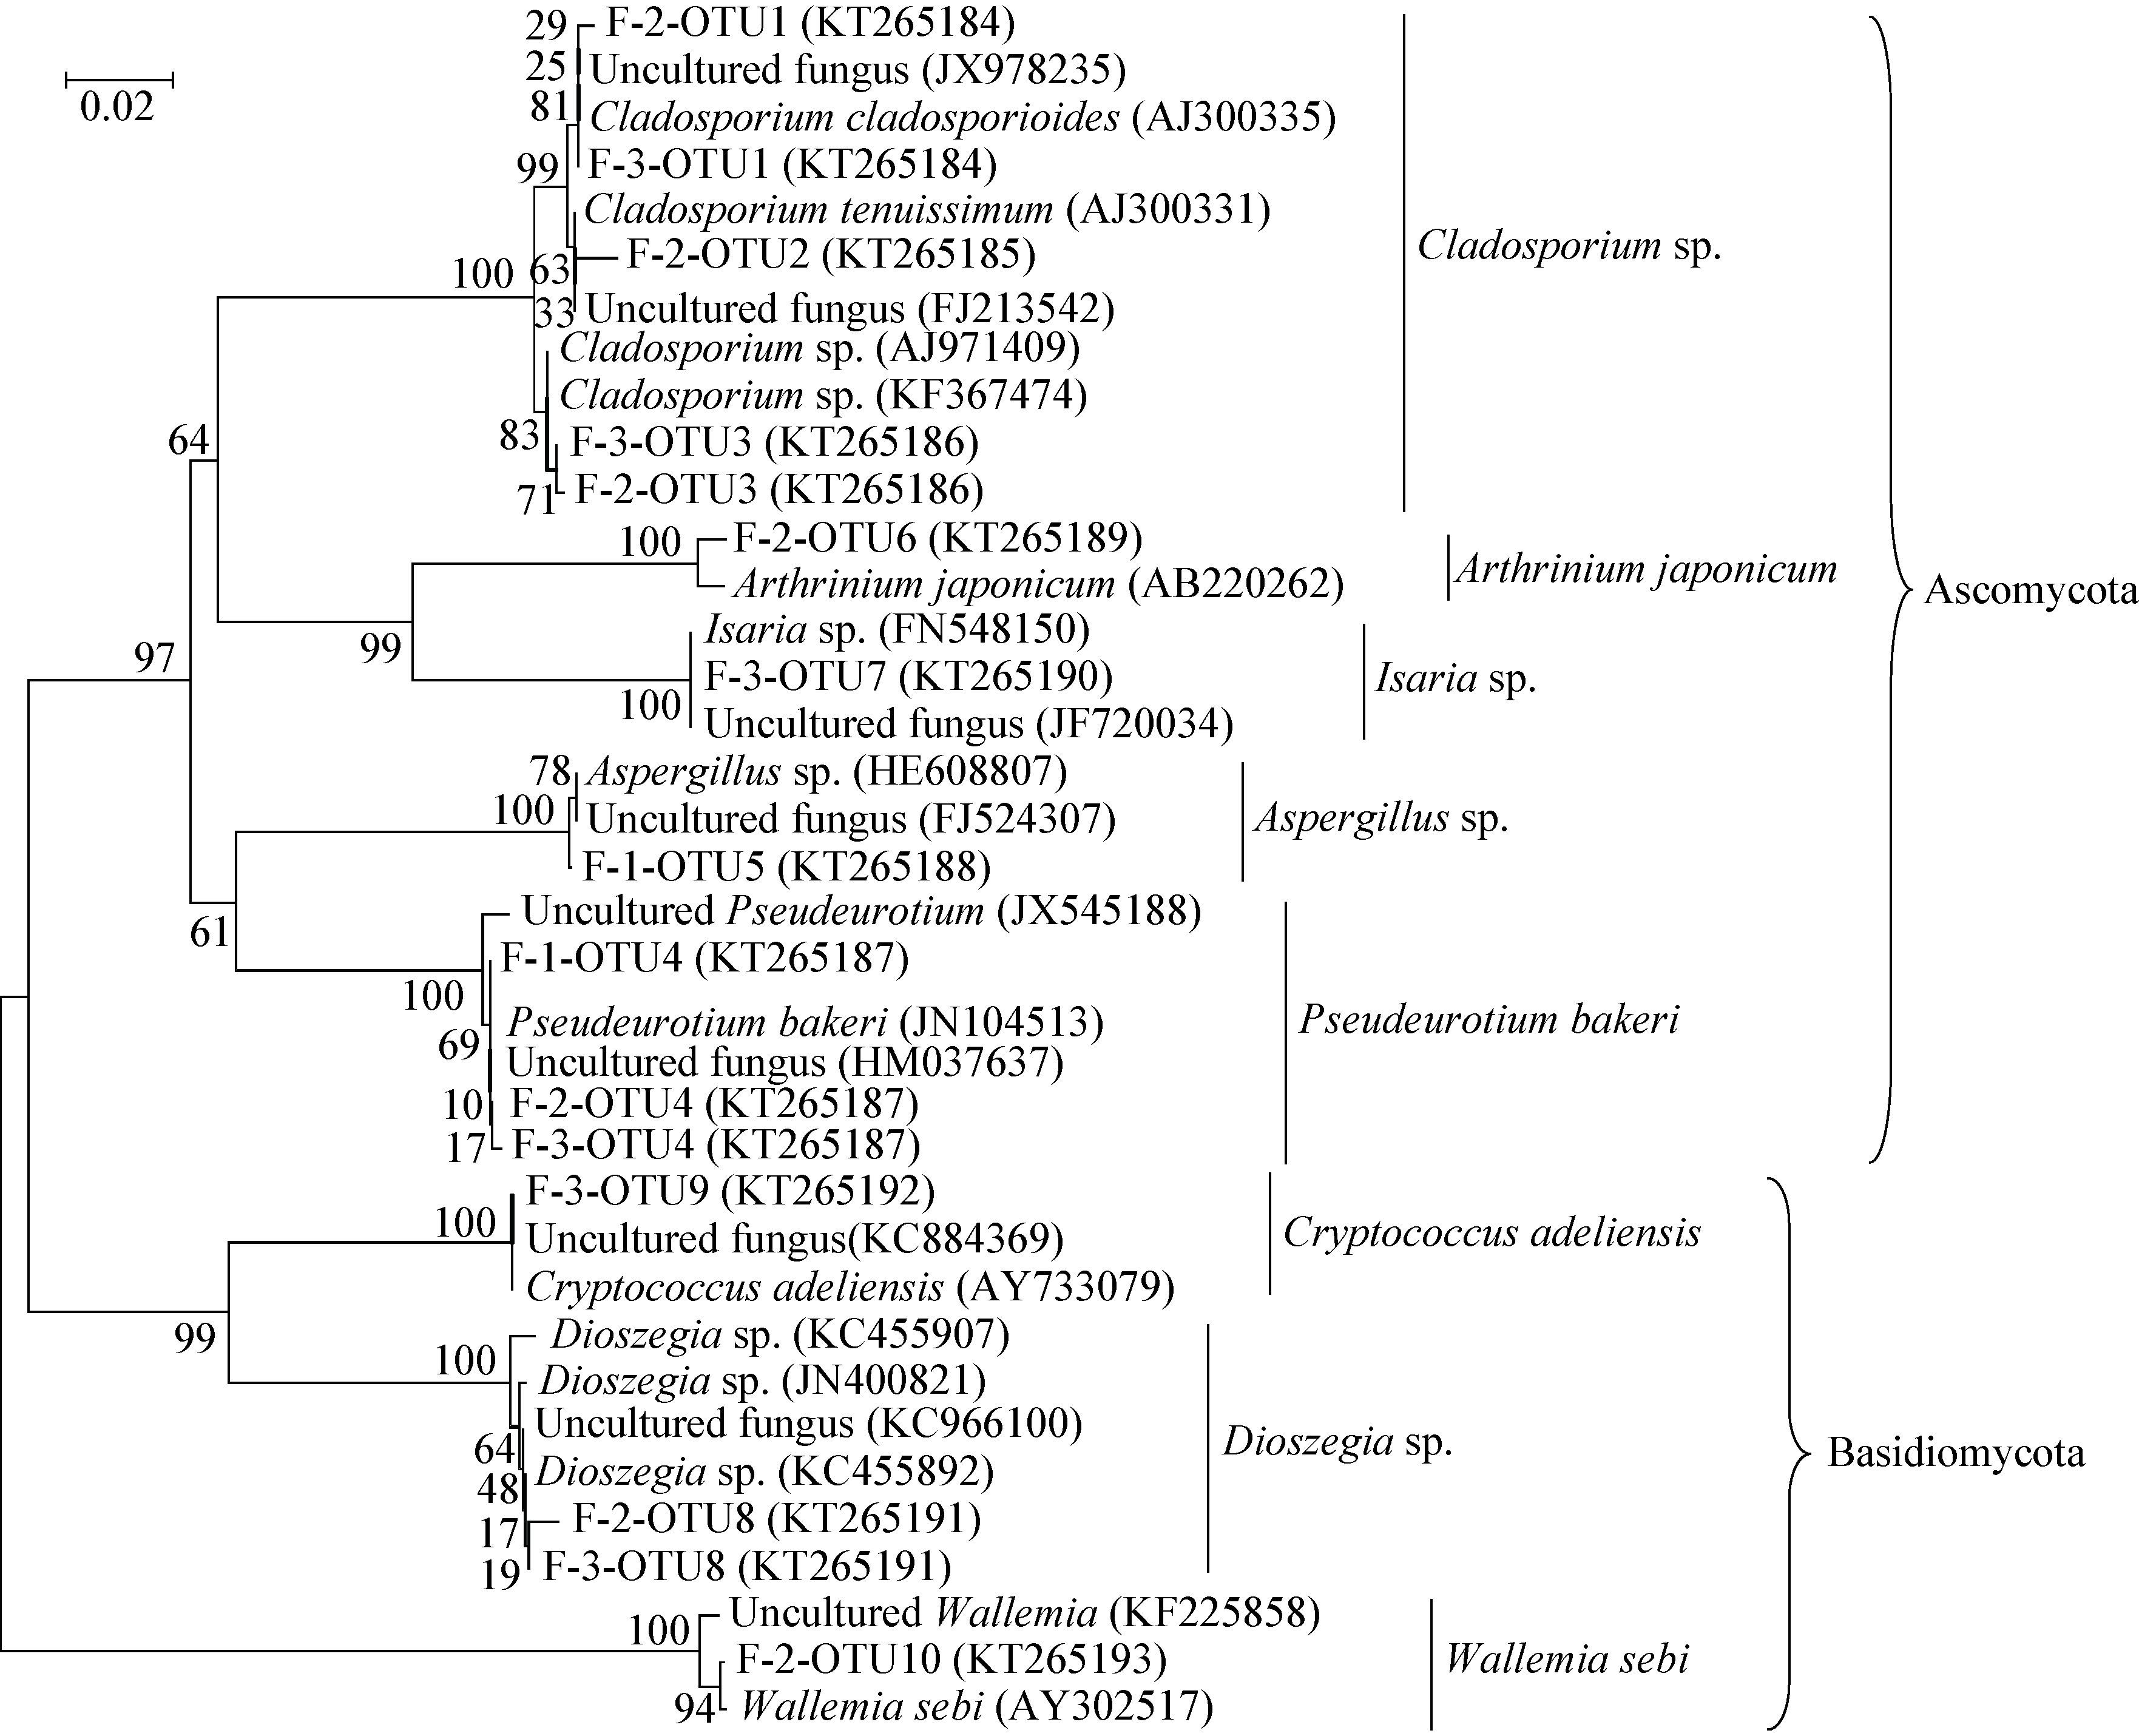
真菌ITS序列系统发育树显示,真菌序列分别属于子囊菌(Ascomycota)和担子菌(Basidiomycota)两大类,分别占克隆序列总数的75.3%和24.7%。共有70个克隆序列属于子囊菌,包括5种类型,Cladosporium sp.、Arthrinium japonicum、Isaria sp.、Aspergillus sp.、Pseudeurotium bakeri。担子菌克隆序列为23个,分属于3种类型,Cryptococcus adeliensis、Dioszegia sp.以及Wallemia sebi。其中Cladosporium sp.、Pseudeurotium bakeri、Dioszegia sp.为剖面真菌主要的优势类群,所占比例为35.5%、34.4%和22.6% (图 5)。
|
| 图 5 青藏高原冻土区剖面土壤中真菌ITS序列系统发育树 Figure 5 Phylogenetic tree of fungal ITS sequences from a stratigraphic soil profile in the Qinghai-Tibetan Plateau 注:F-1表示冻土活动层,F-2表示冻土过渡层,F-3表示冻土层;序列的登录号位于圆括号内;系统发育树分支点处的数字表示置信值(>50%);标尺表示100个核苷酸中有2个被替换. Note: F-1,F-2 and F-3 represent the active layer,the transition layer and the permafrost layer,respectively; The accession number is shown in parenthesis; Numbers at the branch points indicated the bootstrap values (>50%); The scale bar corresponds to 0.02 substitutions per nucleotide position. |
|
|
真菌剖面各层位相对丰度与分布情况见图 6。如图 6所示,冻土活动层只包括Pseudeurotiumbakeri和Aspergillus sp.这两种类型,它们均属于子囊菌,其中Pseudeurotium bakeri为主要的优势类群,在该层所占比例高达96.2%,而Aspergillus sp.仅占3.8%;在冻土过渡层与冻土层、子囊菌与担子菌之间的比例相接近,分别为62.8%、37.2%和68.8%、31.2%。Cladosporium sp.在剖面3个层位之间所占的比例分别为0、40.0%和59.4%,说明随着剖面深度的增加Cladosporium sp.的相对丰度逐渐增加,其中OTU1相对丰度增加最为明显,OTU1未出现于冻土活动层,而在冻土层相对比例达到50.0%,推测与冻土层的低温环境有关(表 2);真菌OTU的垂直分布显示,OTU5仅出现于冻土活动层,OTU9仅出现于冻土层,分别占比3.8%和3.1%,随着深度的增加OTU4的比例迅速降低,由冻土活动层的96.2%降低到冻土层的6.3%,这说明Aspergillus sp.与Cryptococcus adeliensis的出现可能与土壤地温有一定的相关性,Pseudeurotium bakeri则表现出了一定的嗜温性。
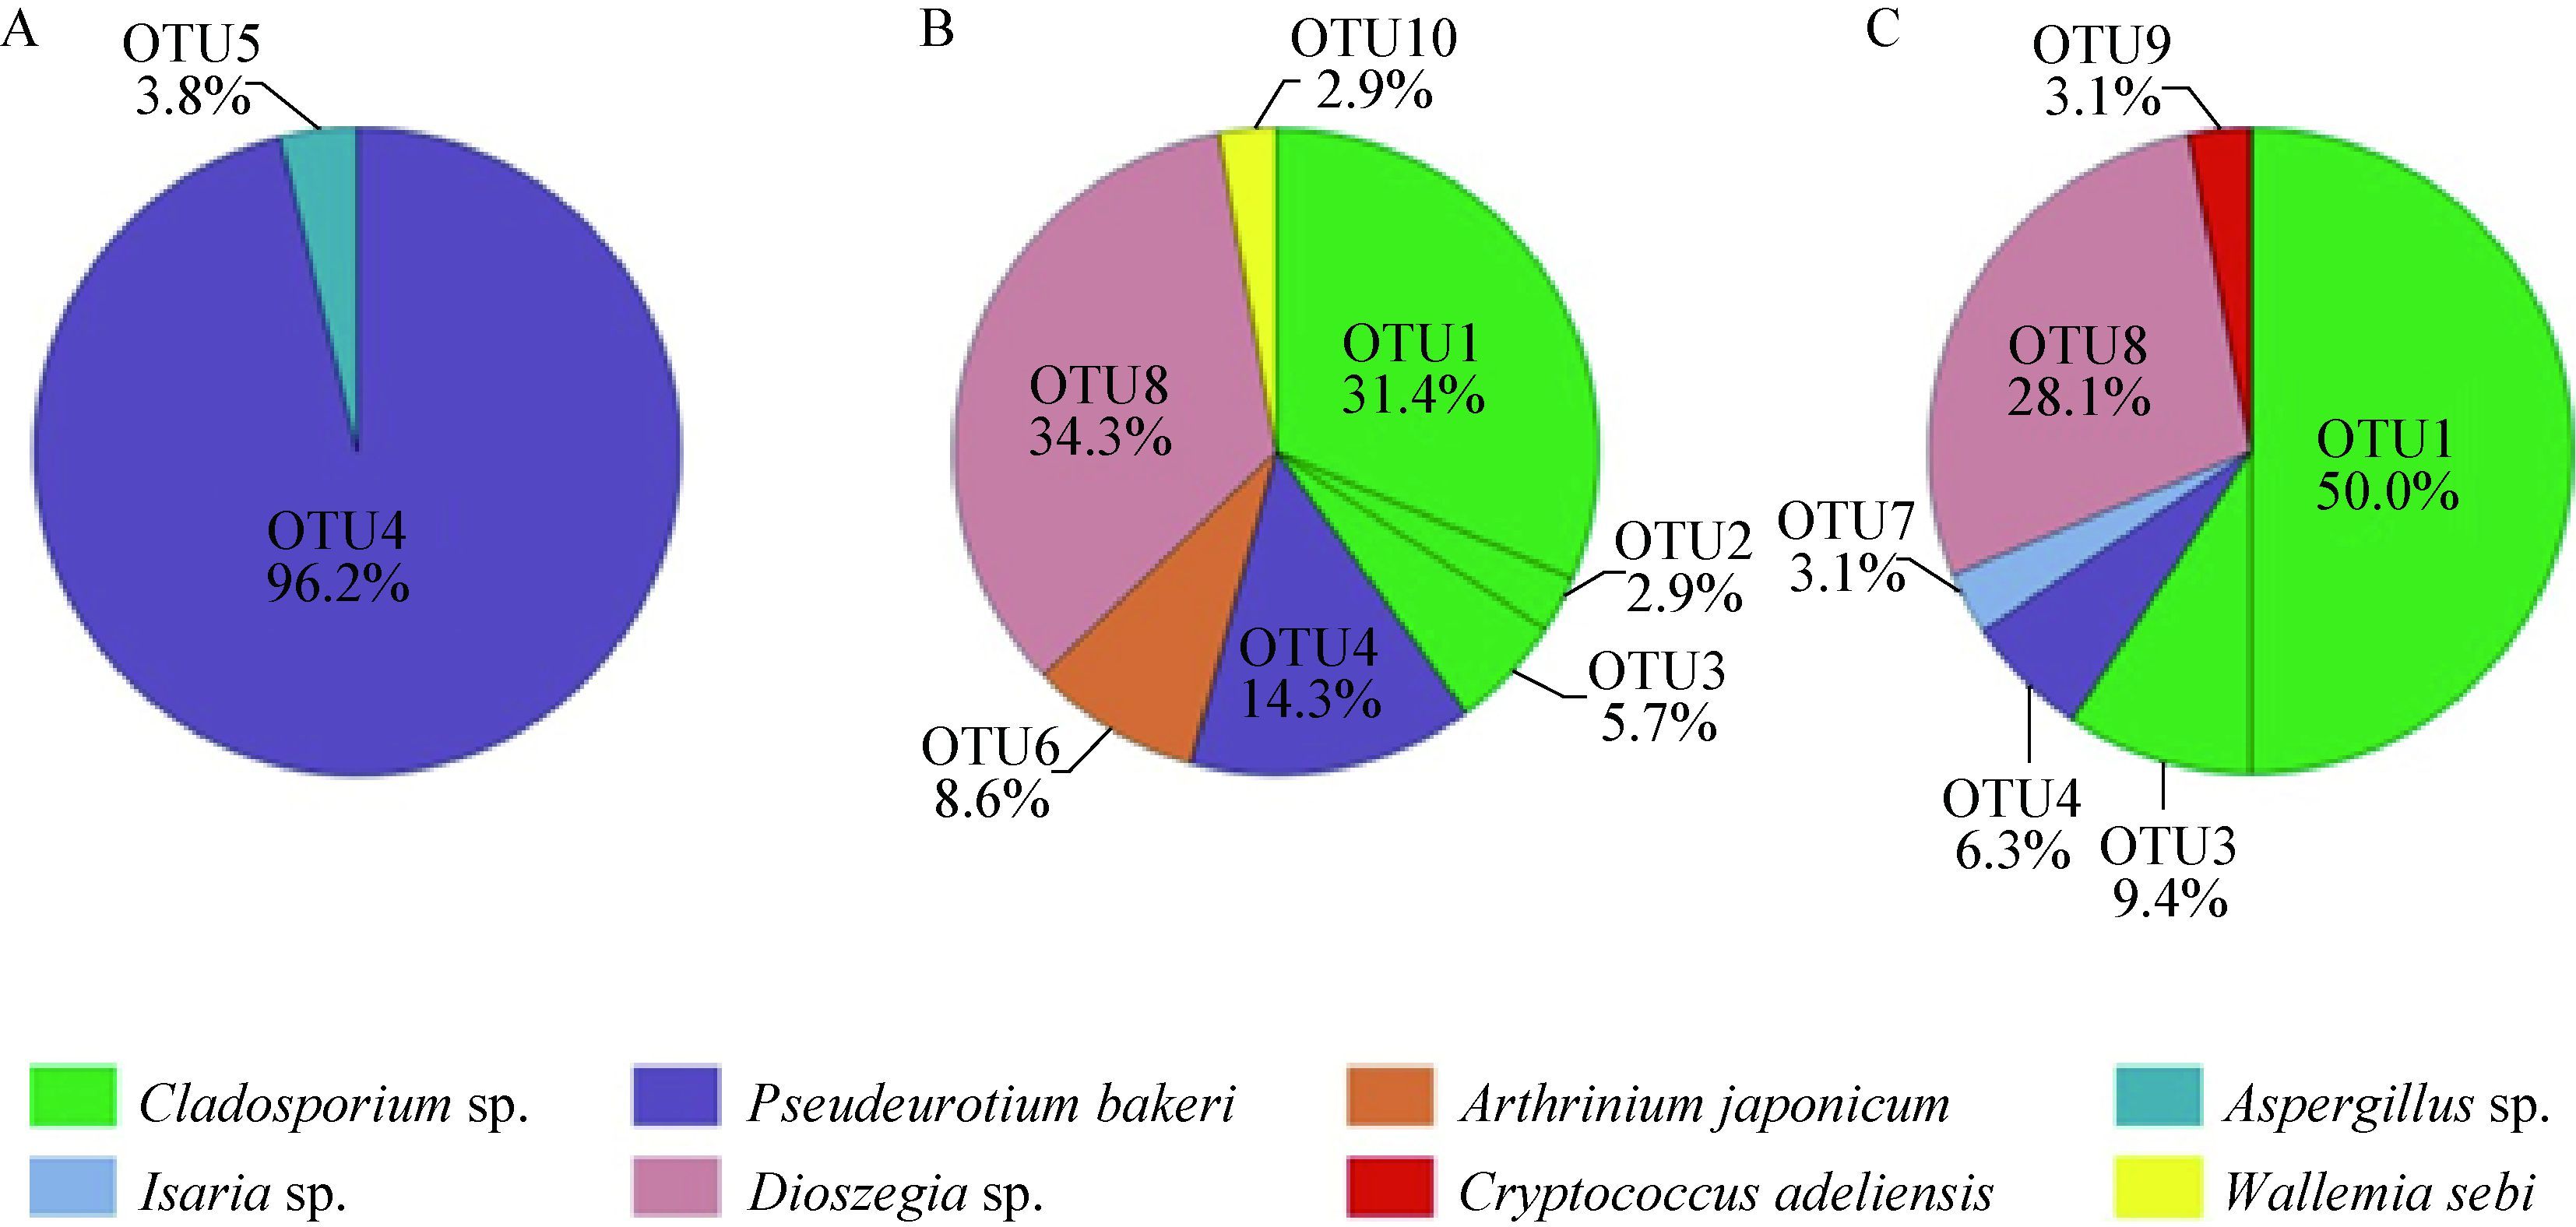
|
| 图 6 DP-14剖面不同深度真菌OTU分析图 Figure 6 Relative abundance and distribution of each fungal OTU along the soil profile of DP-14 注:A表示冻土活动层;B表示冻土过渡层;C表示冻土层. Note: A,B and C represent the active layer,the transition layer and the permafrost layer,respectively. |
|
|
作为全球最大的碳库,冻土对于维持寒区碳平衡以及全球生态平衡都具有重要的作用,资料显示青藏高原草地土壤总CO2的释放率约为1.27 Pg C/年[24]。在过去40年里,青藏高原温度持续升高,增温率为0.16 ℃/10年[37]。这一地区已经成为潜在的温室气体释放区[38]。本文研究表明,总有机碳在冻土过渡层与冻土层所占的比例分别为7.52%和10.90%,明显高于该区另一位点所测得的总有机碳水平[39],与西伯利亚冻土区所得到的测定结果大体相同[40]。而冻土活动层中TOC含量高达20.08%,这可能与该层较高的草根含量有关。甲烷的测定结果显示,冻土层具有最高的甲烷含量(206.43 nmol/g),这可能与该区冻土层之下存在天然气水合物有关,资料显示该区天然气水合物产于冻土层之下,埋深 133 m-396 m,当水合物分解释放出甲烷并发生泄漏,它会沿着裂缝及断层等通道向上运移[25-26]。
古菌16S rRNA基因序列系统发育树显示冻土活动层与冻土层的优势类群均为广古菌(Euryarchaeota),所占比例为71.5%和93.7%,而泉古菌(Crenarchaeota)在活动层所占的比例为28.5%,高于广古菌(6.3%)。这一结果与Wilhelm等[14]对加拿大北极地区的研究有很大差别,其结果显示冻土活动层与冻土层的优势门类为泉古菌(71%、95%),广古菌在活动层的比例高于冻土层(22%、4%),这可能与两地区所处纬度与海拔高度有关。资料显示,随着温度的降低泉古菌的丰度将呈现增加的趋势,泉古菌可能更适应低温寒冷的环境[41]。本研究结果显示,尽管在冻土过渡层泉古菌具有微弱的优势(51.5%),但其在冻土层的比例(6.3%)要明显低于冻土活动层(28.5%),表明泉古菌可能对于低温环境更加敏感。OTU1-OTU5属于广古菌,随着深度的增加,广古菌相对丰度呈现增加的趋势(由冻土活动层的71.5%增加到冻土层的93.7%),其中OTU1增加趋势较为明显,说明OTU1可能更加适应低温环境,OTU1属于Methanomicrobiales,本研究结果显示Methanomicrobiales具有一定的嗜冷性。OTU3属于Methanosaetaceae,仅出现于冻土活动层且所占比例较大(25.7%) (图 2),本研究表明Methanosaetaceae对于低温环境敏感。随着深度的增加,Methanosarcinaceae、Methanobacteriaceae相对丰度呈现出增加的趋势,这可能与冻土层较低的温度以及较高的甲烷含量有关。Yavitt等[42]对加拿大冻土区的研究表明,Methanosarcinaceae在草地土壤中存在最为普遍,这与本文剖面所显示的结果较为相似,然而与本文结果有较大差异的是,Yavitt等的研究结果显示Methanosaetaceae存在于草地土壤的最深部;资料显示Methanosarcinaceae能够进行乙酸代谢产甲烷作用,且更加适应酸性环境,而Methanosaetaceae是一类能够在寒冷的温带沼泽地区进行乙酸营养代谢产甲烷作用的产甲烷菌,在草地土壤深部这一过程通常有赖于细菌的产乙酸作用。Group1.3b/MCG-A在冻土过渡层占有较高的比例(51.5%),Ochsenreiter等[43]的研究结果表明Group1.3b/MCG-A属于泉古菌,且在不同的生态环境下分布都较为广泛。与本文的研究较为相似的是,对地处挪威的弱酸性泥沼湿地研究显示,样地检测到隶属于Methanomicrobiales、Methanobacteriaceae、Methanosaetaceae、Methanosarcinaceae的序列,均属于产甲烷古菌[44]。古菌群落多样性在冻土活动层与冻土层之间的变化将对冻土碳循环产生一定的影响,例如,在本研究中,隶属于广古菌门的Methanosaetaceae在活动层占有较高的比例(25.7%),它能够进行乙酸代谢产生甲烷,冻土温度升高可以增加Methanosaetaceae的产甲烷活性,增加CH4的产生速率。对于冻土环境下产甲烷古菌的分布、群落结构组成、产甲烷途径等对环境变量、气候变化的响应机制仍缺乏明确的结论,有待开展更加深入、广泛的研究[45]。
通过对细菌16S rRNA基因序列进行系统发育分析(图 3)可知,本研究青藏高原冻土区垂直剖面细菌具有丰富的多样性,冻土活动层细菌组成与加拿大北极地区活动层细菌群落组成较为相似[14]。冻土层以放线菌(Actinobacteria)为主要的优势类群,所占比例为62.1%。随着深度的增加,放线菌呈现明显增加的趋势。研究表明,放线菌更加适应低温环境[14]。变形菌(Proteobacteria)在冻土层与活动层也存在较大的差异。研究显示通常在活动层,变形菌具有一个很高的比例[46],这与本文的研究结果也较为相符,如图 4所示,在冻土活动层变形菌具有 一个相对较高的比例,其相对丰度为28.6%,随着深度增加,其相对丰度迅速降低。厚壁菌(Firmicutes)随深度增加相对丰度呈现出降低的趋势,在活动层除变形菌外,厚壁菌也占有较高的比例(25.0%),本研究所得厚壁菌序列经NCBI比对均属于Clostridia。资料显示大多数Clostridia的同源序列主要来自于高山和极地环境[47]。冻土过渡层则表现出了更高的细菌多样性(图 4),除放线菌外,细菌各类群之间的相对比例差异较小,这可能与过渡层较低的含水量、TOC含量有关(表 2)。Debruyn等[48]的研究认为Gemmatimonadetes与土壤湿度间存在相反的关系,在干旱的土壤中数量较多,Gemmatimonadetes仅出现于剖面过渡层,这可能与该层较低的含水量有关。据相关研究,细菌的分布与群落组成主要受温度与pH的影响,由于本研究区特殊的地理位置与理化性质,因此细菌群落结构组成与其他地区相比存在较大的差异,分析这可能与该研究区特殊的温度与pH有关[14, 46-47]。通过与前人的研究结果进行对比,我们发现放线菌对于低温环境具有很好的适应性,而Gemmatimonadetes则对于土壤的湿度变化较为敏感。在冻土逐渐退化的背景下,本研究指出剖面土壤细菌的多样性组成对于冻土生态环境的变化具有一定的指示作用。本文采用27F/1492R引物对细菌16S rRNA基因进行PCR扩增,该引物可对16S rRNA基因全长进行扩增。根据相关文献,由于细菌的基因组内存在16S rRNA基因的多样性,在对细菌16S rRNA基因全长和不同区段进行扩增时,细菌多样性的估计会出现偏差[49]。因此,本研究所得到的扩增结果中,Firmicutes、Proteobactreia、Actinobacteria和Bacteroidetes等类群的相对丰度存在不同程度的高估。
真菌作为土壤微生物的重要组成部分,在整个高寒草地生态系统的结构和功能上都占有十分重要的地位,研究其群落组成与数量的变化可以在更深层次上揭示草地生态系统能量流动与物质循环过程的重要环节[50]。本文所研究的青藏高原冻土区垂直剖面土壤子囊菌(Ascomycota)与担子菌(Basidiomycota)组成比例为75.3%和24.7%。冻土活动层的26个克隆序列均属于子囊菌,说明活动层土壤真菌多样性较低(图 6),推测与活动层较高的地温有关。子囊菌与担子菌在冻土过渡层和冻土层具有相似的比例,两者之间的差异不明显。随着深度的增加,Pseudeurotium bakeri与Cladosporium sp.的相对丰度变化较为明显,两者均属于子囊菌。其中Pseudeurotium bakeri随深度增加相对丰度降低,而Cladosporium sp.的相对丰度则表现为随深度增加,推断这可能与冻土活动层和冻土层的地温差异、有机质含量有关。Ferrari等[51]对来自南极冻土的真菌进行培养后发现,在有机质含量高的条件下Pseudeurotium bakeri成为主要的优势类群,本研究所得结果与Ferrari等的研究结果较为吻合,说明Pseudeurotium bakeri可能更加适应有机质含量较高的环境,Pseudeurotium bakeri的相对丰度与土壤有机质含量之间的相关性说明,Pseudeurotium bakeri对于土壤有机质的运移具有一定的指示作用。研究表明Cladosporium sp.的分布环境十分广泛,在空气以及下层地层中都较容易被分离,这与本研究冻土层Cladosporium sp.相对丰度高也较为符合[52]。有资料显示Cladosporium sp.也参与生物的降解过程[53]。本研究中Aspergillus sp.仅出现于冻土活动层,隶属于子囊菌门,有研究显示Aspergillus sp.在不同的水环境中均被发现,其对高温具有较好的适应性[54],因此,土壤Aspergillus sp.相对丰度的变化在一定程度上可以指示出环境温度的变化,而这些变化又可以反映出冻土的冻融状态。
4 结论在本文中,我们对青藏高原冻土区垂直剖面微生物群落的分布与多样性进行了分析。其中古菌以广古菌门和泉古菌门为主要的优势类群,真菌主要由子囊菌门和担子菌门两个门类组成,剖面细菌的多样性较为丰富,分属于10个类群,其中放线菌、厚壁菌与变形菌为主要的优势类群。随着剖面深度的增加,冻土土壤古菌、细菌与真菌群落结构组成及其数量都发生了较大的变化,说明在该冻土区,冻土土壤的理化性质(包括深度、温度、pH、TOC、甲烷含量等)及该区生态环境的变化与冻土微生物之间存在一定的关联机制。剖面冻土活动层与冻土层微生物beta多样性差异较为明显,说明在不同的冻土生态环境下微生物的种类组成以及分布情况将发生较大的变化。冻土微生物群落组成在冻土层与活动层之间存在一定的差异性,在一定程度上能够反映出冻土层向冻土活动层过渡的趋势,进而反映了青藏高原冻土退化的事实,这可能对冻土生态环境的变化具有重要的指示作用。本研究将有助于更好地了解高山冻土区微生物群落结构组成及其多样性特征,将有助于更好地评估冻土生态系统未来对全球气候变化的影响。对冻土区垂直剖面上活动层与冻土层微生物多样性的监测是一个长期的过程,本文仅对2014年冬季该区一冻土垂直剖面微生物多样性进行了研究,剖面微生物多样性和冻土区生态环 境关系的进一步探讨还有待于建立在未来获得更多的冻土土壤微生物和生态环境相关性分析的基础上。
| [1] | Zhang T, Barry RG, Knowles K, et al. Statistics and characteristics of permafrost and ground ice distribution in the Northern Hemisphere[J]. Polar Geography , 1999, 23 (2) : 147–169. |
| [2] | Yergeau E, Hogues H, Whyte LG, et al. The functional potential of high Arctic permafrost revealed by metagenomic sequencing, qPCR and microarray analyses[J]. The ISME Journal , 2010, 4 (9) : 1206–1214. DOI:10.1038/ismej.2010.41 |
| [3] | Steven B, Léveillé R, Pollard WH, et al. Microbial ecology and biodiversity in permafrost[J]. Extremophiles , 2006, 10 (4) : 259–267. DOI:10.1007/s00792-006-0506-3 |
| [4] | Dobinski W. Permafrost[J]. Earth-Science Reviews , 2011, 108 (3/4) : 158–169. |
| [5] | Zimov SA, Schuur EAG, Chapin FS. Permafrost and the global carbon budget[J]. Science , 2006, 312 (5780) : 1612–1613. DOI:10.1126/science.1128908 |
| [6] | Tarnocai C, Canadell JG, Schuur EAG, et al. Soil organic carbon pools in the northern circumpolar permafrost region[J]. Global Biogeochemical Cycles , 2009, 23 (2) : 1–11. |
| [7] | Dutta K, Schuur EAG, Neff JC, et al. Potential carbon release from permafrost soils of Northeastern Siberia[J]. Global Change Biology , 2006, 12 (12) : 2336–2351. DOI:10.1111/gcb.2006.12.issue-12 |
| [8] | Stendel M, Romanovsky VE, Christensen JH, et al. Using dynamical downscaling to close the gap between global change scenarios and local permafrost dynamics[J]. Global and Planetary Change , 2007, 56 (1/2) : 203–214. |
| [9] | Payette S, Delwaide A, Caccianiga M, et al. Accelerated thawing of subarctic peatland permafrost over the last 50 years[J]. Geophysical Research Letters , 2004, 31 (18) : L18208. DOI:10.1029/2004GL020358 |
| [10] | Camill P. Permafrost thaw accelerates in boreal peatlands during late-20th century climate warming[J]. Climatic Change , 2005, 68 (1/2) : 135–152. |
| [11] | Le Mer J, Roger P. Production, oxidation, emission and consumption of methane by soils: A review[J]. European Journal of Soil Biology , 2001, 37 (1) : 25–50. DOI:10.1016/S1164-5563(01)01067-6 |
| [12] | Yang ZP, Ou YH, Xu XL, et al. Effects of permafrost degradation on ecosystems[J]. Acta Ecologica Sinica , 2010, 30 (1) : 33–39. DOI:10.1016/j.chnaes.2009.12.006 |
| [13] | Steven B, Briggs G, McKay CP, et al. Characterization of the microbial diversity in a permafrost sample from the Canadian high Arctic using culture-dependent and culture-independent methods[J]. FEMS Microbiology Ecology , 2007, 59 (2) : 513–523. DOI:10.1111/fem.2007.59.issue-2 |
| [14] | Wilhelm RC, Niederberger TD, Greer C, et al. Microbial diversity of active layer and permafrost in an acidic wetland from the Canadian High Arctic[J]. Canadian Journal of Microbiology , 2011, 57 (4) : 303–315. DOI:10.1139/w11-004 |
| [15] | Kobabe S, Wagner D, Pfeiffer EM. Characterisation of microbial community composition of a Siberian tundra soil by fluorescence in situ hybridization[J]. FEMS Microbiology Ecology , 2004, 50 (1) : 13–23. DOI:10.1016/j.femsec.2004.05.003 |
| [16] | Timling I, Dahlberg A, Walker DA, et al. Distribution and drivers of ectomycorrhizal fungal communities across the North American Arctic[J]. Ecosphere , 2012, 3 (11) : 1–25. |
| [17] | Yang SZ, Jin HJ, Wei Z, et al. Microbial adaptation to the habitat of permafrost and their responses to global change and engineering disturbance in cold regions: advances and prospects[J]. Journal of Glaciology and Geocryology , 2007, 29 (2) : 279–285. (in chinese) 杨思忠, 金会军, 魏智, 等. 微生物对冻土生境的适应以及对全球变化和寒区工程扰动的响应: 进展与展望[J]. 冰川冻土 , 2007, 29 (2) : 279–285. |
| [18] | Chu HY. Microbial communities in high latitudes and high altitudes ecosystems[J]. Microbiology China , 2013, 40 (1) : 123–136. (in chinese) 褚海燕. 高寒生态系统微生物群落研究进展[J]. 微生物学通报 , 2013, 40 (1) : 123–136. |
| [19] | Yang SZ, Jin HJ. Physiological and ecological effects of freezing and thawing processes on microorganism in seasonally-froze ground and in permafrost[J]. Acta Geographica Sinica , 2008, 28 (10) : 5065–5074. (in chinese) 杨思忠, 金会军. 冻融作用对冻土区微生物生理和生态的影响[J]. 生态学报 , 2008, 28 (10) : 5065–5074. |
| [20] | Sun XX, Song CC, Wang XW, et al. Effect of permafrost degradation on methane emission in wetlands: a review[J]. Acta Ecologic Sinica , 2011, 31 (18) : 5379–5386. (in chinese) 孙晓新, 宋长春, 王宪伟, 等. 多年冻土退化对湿地甲烷排放的影响研究进展[J]. 生态学报 , 2011, 31 (18) : 5379–5386. |
| [21] | Jin HJ, Li SX, Wang SL, et al. Impacts of climatic change on permafrost and cold regions environment in China[J]. Acta Geographica Sinica , 2000, 55 (2) : 161–173. (in chinese) 金会军, 李述训, 王绍令, 等. 气候变化对中国多年冻土和寒区环境的影响[J]. 地理学报 , 2000, 55 (2) : 161–173. |
| [22] | Zhu YH, Lu ZQ, Xie XL. Potential distribution of gas hydrate in the Qinghai-Tibetan Plateau[J]. Geological Bulletin of China , 2011, 30 (12) : 1918–1926. (in chinese) 祝有海, 卢振权, 谢锡林. 青藏高原天然气水合物潜在分布区预测[J]. 地质通报 , 2011, 30 (12) : 1918–1926. |
| [23] | Li L, Zhu XD, Wang QC, et al. Mapping and analyses of permafrost change in the Qinghai Plateau using GIS[J]. Journal of Glaciology and Geocryology , 2005, 27 (3) : 320–328. (in chinese) 李林, 朱西德, 汪青春, 等. 青海高原冻土退化的若干事实揭示[J]. 冰川冻土 , 2005, 27 (3) : 320–328. |
| [24] | Wang GX, Qian J, Cheng GD, et al. Soil organic carbon pool of grassland soils on the Qinghai-Tibetan Plateau and its global implication[J]. Science of the Total Environment , 2002, 291 (1/3) : 207–217. |
| [25] | Zhu YH, Zhang YQ, Wen HJ, et al. Gas hydrates in the Qilian Mountain permafrost, Qinghai, Northwest China[J]. Acta Geologica Sinica , 2009, 83 (11) : 1762–1771. (in chinese) 祝有海, 张永勤, 文怀军, 等. 青海祁连山冻土区发现天然气水合物[J]. 地质学报 , 2009, 83 (11) : 1762–1771. |
| [26] | Chang HJ. Environmental impacts and management of gas hydrates exploitation in Qinghai Province permafrost[J]. Arid Land Geography , 2012, 35 (4) : 639–645. (in chinese) 常华进. 青海永久冻土区天然气水合物开发的环境影响风险防治[J]. 干旱区地理 , 2012, 35 (4) : 639–645. |
| [27] | Cao DY, Liu TJ, Wang D, et al. Analysis of formation condition of natural gas hydrate in Muli coalfield, Qinghai province[J]. Coal Geology of China , 2009, 21 (9) : 3–6. (in chinese) 曹代勇, 刘天绩, 王丹, 等. 青海木里地区天然气水合物形成条件分析[J]. 中国煤炭地质 , 2009, 21 (9) : 3–6. |
| [28] | Zhang JH, Wei W, Wei XH, et al. Formation condition and characteristics of natural gas hydrate in Muli permafrost[J]. Inner Mongolia Petrochemical Industry , 2013, 39 (13) : 36–39. (in chinese) 张金华, 魏伟, 魏兴华, 等. 木里冻土区天然气水合物形成条件及特征[J]. 内蒙古石油化工 , 2013, 39 (13) : 36–39. |
| [29] | Templer SP, Wehrmann LM, Zhang Y, et al. Microbial community composition and biogeochemical processes in cold-water coral carbonate mounds in the Gulf of Cadiz, on the Moroccan margin[J]. Marine Geology , 2011, 282 (1/2) : 138–148. |
| [30] | Galkiewicz JP, Kellogg CA. Cross-kingdom amplification using bacteria-specific primers: complications for studies of coral microbial ecology[J]. Applied and Environmental Microbiology , 2008, 74 (24) : 7828–7831. DOI:10.1128/AEM.01303-08 |
| [31] | Gardes M, Bruns TD. ITS primers with enhanced specificity of basidiomycetes: application to the identification of mycorrhizae and rusts[J]. Molecular Ecology , 1993, 2 (2) : 113–118. DOI:10.1111/j.1365-294X.1993.tb00005.x |
| [32] | Frank KL, Rogers DR, Olins HC, et al. Characterizing the distribution and rates of microbial sulfate reduction at Middle Valley hydrothermal vents[J]. The ISME Journal , 2013, 7 (7) : 1391–1401. DOI:10.1038/ismej.2013.17 |
| [33] | Li K, Liu RY, Zhang HX, et al. The diversity and abundance of bacteria and oxygenic phototrophs in saline biological desert crusts in Xinjiang, Northwest China[J]. Microbial Ecology , 2013, 66 (1) : 40–48. DOI:10.1007/s00248-012-0164-1 |
| [34] | Hu L, Cao LX, Zhang RD. Bacterial and fungal taxon changes in soil microbial community composition induced by short-term biochar amendment in red oxidized loam soil[J]. World Journal of Microbiology & Biotechnology , 2014, 30 (3) : 1085–1092. |
| [35] | Hill TC, Walsh KA, Harris JA, et al. Using ecological diversity measures with bacterial communities[J]. FEMS Microbiology Ecology , 2003, 43 (1) : 1–11. DOI:10.1111/fem.2003.43.issue-1 |
| [36] | Lin LH, Wu LW, Cheng TW, et al. Distributions and assemblages of microbial communities along a sediment core retrieved from a potential hydrate-bearing region offshore southwestern Taiwan[J]. Journal of Asian Earth Sciences , 2014, 92 (5) : 276–292. |
| [37] | Yang MX, Nelson FE, Shiklomanov NI, et al. Permafrost degradation and its environmental effects on the Tibetan Plateau: A review of recent research[J]. Earth-Science Reviews , 2010, 103 (1/2) : 31–44. |
| [38] | Kang XC. The features of the climate changes in the Qing-Zang Plateau area during the last 40 years[J]. Journal of Glaciology and Geocryology , 1996, 18 (S) : 281–288. (in chinese) 康兴成. 青藏高原地区近40 年来气候变化的特征[J]. 冰川冻土 , 1996, 18 (S) : 281–288. |
| [39] | Wei SP, Cui HP, He H, et al. Diversity and distribution of archaea community along a stratigraphic permafrost profile from Qinghai-Tibetan Plateau, China[J]. Archaea , 2014 . DOI:10.1155/2014/240817 |
| [40] | Schirrmeister L, Siegert C, Kunitzky VV, et al. Late Quaternary ice-rich permafrost sequences as a paleoenvironmental archive for the Laptev Sea Region in northern Siberia[J]. International Journal of Earth Sciences , 2002, 91 (1) : 154–167. DOI:10.1007/s005310100205 |
| [41] | Høj L, Olsen RA, Torsvik VL. Effects of temperature on the diversity and community structure of known methanogenic groups and other archaea in high Arctic peat[J]. The ISME Journal , 2008, 2 (1) : 37–48. DOI:10.1038/ismej.2007.84 |
| [42] | Yavitt JB, Basiliko N, Turetsky MR, et al. Methanogenesis and methanogen diversity in three peatland types of the discontinuous permafrost zone, boreal western continental Canada[J]. Geomicrobiology Journal , 2006, 23 (8) : 641–651. DOI:10.1080/01490450600964482 |
| [43] | Ochsenreiter T, Selezi D, Quaiser A, et al. Diversity and abundance of Crenarchaeota in terrestrial habitats studied by 16S RNA surveys and real time PCR[J]. Environmental Microbiology , 2003, 5 (9) : 787–797. DOI:10.1046/j.1462-2920.2003.00476.x |
| [44] | Høj L, Olsen RA, Torsvik VL. Archaeal communities in High Arctic wetlands at Spitsbergen, Norway (78°N) as characterized by 16S rRNA gene fingerprinting[J]. FEMS Microbiology Ecology , 2005, 53 (1) : 89–101. DOI:10.1016/j.femsec.2005.01.004 |
| [45] | Ni YQ, Shi XW, Zheng XJ, et al. Advance in methane-cycling microbial communities of permafrost and their response to global change[J]. Acta Ecologica Sinica , 2011, 31 (13) : 3846–3855. (in chinese) 倪永清, 史学伟, 郑晓吉, 等. 冻土甲烷循环微生物群落及其对全球变化的响应[J]. 生态学报 , 2011, 31 (13) : 3846–3855. |
| [46] | Zhou JZ, Davey ME, Figueras JB, et al. Phylogenetic diversity of a bacterial community determined from Siberian tundra soil DNA[J]. Microbiology , 1997, 143 (12) : 3913–3919. DOI:10.1099/00221287-143-12-3913 |
| [47] | Larose C, Berger S, Ferrari C, et al. Microbial sequences retrieved from environmental samples from seasonal Arctic snow and meltwater from Svalbard, Norway[J]. Extremophiles , 2010, 14 (2) : 205–212. DOI:10.1007/s00792-009-0299-2 |
| [48] | DeBruyn JM, Nixon LT, Fawaz MN, et al. Global biogeography and quantitative seasonal dynamics of Gemmatimonadetes in soil[J]. Applied and Environmental Microbiology , 2011, 77 (17) : 6295–6300. DOI:10.1128/AEM.05005-11 |
| [49] | Sun DL, Jiang X, Wu QL, et al. Intragenomic heterogeneity of 16S rRNA genes causes overestimation of prokaryotic diversity[J]. Applied and Environmental Microbiology , 2013, 79 (19) : 5962–5969. DOI:10.1128/AEM.01282-13 |
| [50] | Zhang JZ, Chen XR, Yang CD, et al. A study on the diversity of soil cultured fungi in the alpine grassland of Eastern Qilian Mountains[J]. Acta Prataculturae Sinica , 2010, 19 (2) : 124–132. (in chinese) 张俊忠, 陈秀蓉, 杨成德, 等. 东祁连山高寒草地土壤可培养真菌多样性分析[J]. 草业学报 , 2010, 19 (2) : 124–132. |
| [51] | Ferrari BC, Zhang CD, Dorst JV. Recovering greater fungal diversity from pristine and diesel fuel contaminated sub-Antarctic soil through cultivation using both a high and a low nutrient media approach[J]. Frontiers in Microbiology , 2011, 2 (1) : 111–117. |
| [52] | Sterflinger K, Prillinger H. Molecular taxonomy and biodiversity of rock fungal communities in an urban environment (Vienna, Austria)[J]. Antonie van Leeuwenhoek , 2001, 80 (3/4) : 275–286. DOI:10.1023/A:1013060308809 |
| [53] | De la Torre MA, Gomez-Alarcon G, Vizcaino C, et al. Biochemical mechanisms of stone alteration carried out by filamentous fungi living in monuments[J]. Biogeochemistty , 1992, 19 (3) : 129–147. DOI:10.1007/BF00000875 |
| [54] | Oliveira BR, Barreto Crespo MT, San Romão MV, et al. New insights concerning the occurrence of fungi in water sources and their potential pathogenicity[J]. Water Research , 2013, 47 (16) : 6338–6347. DOI:10.1016/j.watres.2013.08.004 |
 2016, Vol. 43


